
SEEFOR 12(1): 35-41
Article ID: 2105
DOI: https://doi.org/10.15177/seefor.21-05
ORIGINAL SCIENTIFIC PAPER
Tree Species Diversity and Spatial Distribution of Aleppo Pine Stands in Northeastern Algeria
Insaf Hani 1,*, Malika Rached-Kanouni1, Ammar Menasri2
(1) University of Larbi Ben M’hidi, Faculty of Exact Sciences and Life Sciences and Nature, Department of Life Sciences and Nature, Laboratory of Functional Ecology and Environment (F.E.E.L), 1st November 1954 Street, Oum el Bouaghi 04000, Algeria;
(2) Abbes Laghrour University, Department of Agronomic Sciences, Road of Oum-El-Bouaghi, PB 1252 Khenchela 40000, Algeria
Citation: Hani I, Rached-Kanouni M, Menasri A, 2021. Tree Species Diversity and Spatial Distribution of Aleppo Pine Stands in Northeastern Algeria. South-east Eur for 12(1): 35-41. https://doi.org/10.15177/seefor.21-05.
Received: 2 Oct 2020; Revised: 2 Jan 2021; Accepted: 9 Mar 2021; Published online: 30 Apr 2021
Cited by: Crossref Google Scholar
Abstract
The spatial pattern of species is one of the key studied parameters in ecology so as to better understand the ecological processes and the functioning of forest ecosystems. This paper describes the classification of structural indices measuring the alpha diversity and examines typical representatives of the classification groups such as the Shannon’s index, aggregation index by Clark and Evans, the mingling index, the diameter differentiation index and the coefficient of segregation by Pielou. The tree inventory made it possible to count 7 species that are divided into six (06) families. Only Pinus halepensis Mill. trees were taken into account via calculation in spatial distribution. Western exposure shows the most regular tree patterns (1.6±0.1) according to the aggregation index by Clark and Evans, while the species mingling index for south- and east-facing stands indicates segregation of Pinus halepensis Mill. groups. The diameter differentiation index for the majority of the studied stands is assumed through estimated values within the range that starts from 0.4 to 0.9 for the four exposures. The distribution shows that western and eastern exposures belong to the fourth class of differentiation (very large differentiation), which means that the trees with the smallest DBH have less than 30% of the size of the neighbouring trees since the diameter differentiation index for the two exposures is 0.9±0.05 and 0.7±0.2.
Keywords: tree species diversity; spatial distribution; Clark and Evans index; mingling index; the diameter differentiation
INTRODUCTION
The characteristics of forest stand structure are of a great interest to various groups of stakeholders. Moreover, the monitoring of tree diversity and forest structure is a crucial prerequisite for understanding and maintaining forest habitats. Structural indices have been widely accepted as sound measures for biodiversity conservation purposes (Motza et al. 2010).
Biodiversity is a key element for evaluating the stability of the system in managed forests as well as in old-growth ecosystems (Kimmins 1997). Forest structure as a term has multiple meanings (Indir et al. 2013). According to Kimmins (1997), the structure of plant community is viewed in terms of vertical and horizontal spatial organization. The majority of indices quantifying forest structure can be divided into two major groups; distance-independent and distance-dependent measures (Tomé et al. 1989, Sylvie 1998, Pommerening 2002). While the first group evaluates stand structure without any spatial reference (Tomé et al. 1989, Pommerening 2002, Cordonnier et al. 2012, Pommerening and Grabarnik 2019), the second group can be subdivided into individual or single tree parameters based on neighbourhood relations (Pommerening 2002, Pommerening et al. 2006). Accounting for small-scale differences in biodiversity, distance-dependent measures describe forest stand structure at the stand level (Indir et al. 2013).
In the present study, diversity was evaluated at stand level (α diversity) which represents the number of species in the stand, their proportion, as well as their distribution (Rached-Kanouni et al. 2020a). Three of the distance-dependent stand structure measures were thus used; the aggregation index by Clark and Evans, the species mingling index and the diameter differentiation index. The results are discussed with referring to some simulated references and suggestions are provided to show how these methods could be applied for Pinus halepensis Mill. in Beni Oudjana forest (Algeria).
MATERIALS AND METHODS
Study Area
The study was conducted in Beni Oudjana forest (Figure 1), which is part of a forest and pastoral area of the Aures Massif (eastern Algeria) located between longitude (X1: 6°58’07", X2: 6°42’34") and latitude (Y1: 35°28’22", Y2: 35°19’04") (Hani et al. 2020). The altitude of the sample plots ranges from 1024 m to 1472 m above sea level. The climate of this forest massif is characterized by a long dry and hot summer season and an increasing number of years with less rainfall. Rainfall is generally low and irregular. The rainfall gradient decreases from north to south (Bentouati 2006, Goubi et al. 2019). Average annual temperatures range from 13.6 to 14.9°C (Bentouati 2006, Goubi et al. 2019, Rached-Kanouni et al. 2020b). The substratum is of marly and marly-limestone type for the pine forest. From a bioclimatic standpoint, most of the pine forests have a north and north-west orientation and they are located in the sub-humid stage during cold winters (Bentouati 2006, Hani et al. 2020). This forest area is composed of several softwood and hardwood species, namely Aleppo pine (Pinus halepensis Mill.), holm oak (Quercus ilex L.), cade juniper (Juniperus oxycedrus L.), Phoenicean juniper (Juniperus phoenicea L.), atlas cedar (Cedrus atlantica), mastic pistachio (Pistacia lentiscus L.), narrow-leaved mock privet (Phillyrea angustifolia L.) and rosemary (Rosmarinus officinalis L.) (Hani et al. 2020).
![]() Figure 1. Geographical location of the study area (Bentouati 2006).
Figure 1. Geographical location of the study area (Bentouati 2006).
Field Measurements
The experimental trial has 16 plots distributed in the area of Aleppo pine with the regeneration of other species stands (Figure 2). The study plots were randomly selected in relation to different cardinal exposures (east, south, west and north). Vegetation data were collected in rectangular plots of 25 m × 20 m (500 m2) and their characteristics are illustrated in Table 1. On each plot, the tree species were distinguished, and the diameters of all trees with DBH>5.0 cm. In order to calculate Clark and Evans index, DBH differentiation (Tij) and species mingling (Mi) indices, the distance between the nearest trees in relation to the referent tree should be measured. X and Y coordinates were recorded for each tree in each of the 16 plots.
![]() Figure 2. Mixed stand of Aleppo pine exposed to the north (plot N1).
Figure 2. Mixed stand of Aleppo pine exposed to the north (plot N1).
Data Analysis
Tree Species Diversity
At the scale of a stand, biodiversity indicators are usually placed into one of two categories; those that are based on the identification of key tree species and on the identification of key structures (Lindenmayer et al. 2000, McElhinny et al. 2005).
One of the first diversity indices was species richness (SR). This index evaluates the number of tree species in the stand (Gonçalves et al. 2010). Though it enables to distinguish diversity as a function of the number of species, it does not give any information regarding the weight of each species in the mixture. Thus, two stands have the same number of species, where one has a similar number of individuals per species and the other has a much higher number of individuals of one of the species which are classified in the same type (Gonçalves 2003).
The Shannon’s index (H’) (Equation 1) was used to evaluate tree species diversity at different plots (Shannon et al. 1949). Its computation was performed through employing the following equation:
 (1)
(1)
where Pj is the probability of a randomly selected tree belonging to tree species j; and n is the number of tree species in the forest. If there is only one species recorded on the subplot, the Shannon’s index H’ is equal to zero. For k species with equal proportions, H’ corresponds to ln(k) (Keren et al. 2020). A similar index (Equation 2), also working with probabilities, was developed by Simpson (1949) and based on the heterogeneity, measuring the probability of two individuals randomly chosen belonging to the same species (Pierrat 1995, Gaines et al. 1999, Gonçalves et al. 2010). It ranges from 0 to 1, and decreases with the increase of the number of species and with the proximity of the species frequencies (Simpson 1949).
 (2)
(2)
where ni is number of individuals in species i; and N is the total number of individuals.
Spatial Distribution
For each individual sample plot, the aggregation index by Clark and Evans (R) (Equation 3) was calculated with no correction for edge effects. The aggregation index by Clark and Evans and numerical variables were developed to describe aspects of the variability of tree location in forest stands by a signal value (Evans 1950-1960). One example is the aggregation index by Clark and Evans (1954) which is defined as follows:
![]() (3)
(3)
where 
where observed stands for the mean of the distances from the trees to their nearest neighbours in a given forest stand, while E(r) is the mean nearest neighbour distance in the stand with completely random tree locations of intensity λ=N/A with A = area of the forest stand and N= number of trees (Pommerening and Stoyan 2006, Pommerening and Uria-Diez 2017). Usually, the interpretation of R values is as follows: R>1 if the pattern tends regularity, R=1 if it is completely random and R<1 if there is clustering in the pattern (Clark and Evans 1954).
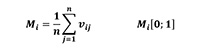
Mingling index (Mi) (Equation 4) gives for each individual tree i the proportion of its n nearest neighbours that do not belong to the same species as the reference tree i (Gadow 1993). Figure 3 illustrates the index for the case n = 4. The mingling index can only take one of a limited number of values. For example, when n = 4 neighbours there are n + 1 = 5 possible values of Mi, calculated as k/n, with k = 0, 1, …, n: (0,00; 0,25; 0,50; 0,75; and 1,00) (Pommerening and Stoyan 2006, Indir et al. 2013, Pommerening and Uria-Diez 2017). Using these scores, all trees of the stand can be individually classified and the overall stand structure can be characterized by the distribution of the values of Mi. The mean population mingling can be expressed as follows:
 (4)
(4)
Mi: is the species mingling index; n: is the number of the nearest neighbouring trees (3 or 4) Vij = 1, if the reference tree i and the neighbour j are different tree species; Vij = 0, otherwise (Pommerening 2002, Pommerening and Grabarnik 2019).
![]() Figure 3. Illustration of the mingling index for n=4 neighbours (Gadow 1993).
Figure 3. Illustration of the mingling index for n=4 neighbours (Gadow 1993).
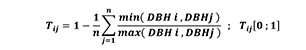
The examination of the DBH differentiation index (Tij) (Equation 5) indicates the range of the difference in size of the 4 nearest neighbouring trees and describes the spatial distribution of tree sizes (Pretzsch 2009, Indir et al.2013, Keren et al.2020) which was calculated through the application of the following formula:
 (5)
(5)
where Tij represents DBH differentiation index; DBH = diameter at breast height (in cm) thereby, i stands for a reference tree, j refers to the closest neighbour trees. Therefore, the DBH differentiation index was computed by using four closest neighbour trees around each reference tree (Pommerening 2002).
Pielou’s coefficient of segregation (S’) (Equation 6) describes the degree of mixing for a two species tree (Pommerening and Grabarnik 2019). This coefficient is defined as:
 (6)
(6)
If the nearest neighbours are always of the same spe-cies as the reference trees, then S’=1. If all neighbours are of a different species, then S’=-1. In the case of complete randomness of species distribution, one can expect values around 0 (Pielou 1977).
RESULTS
The results of this study provide significant information concerning the variation in tree species diversity and the spatial distribution of Aleppo pine stands in Beni Oudjana forest. The tree species inventory gave the reported results in Table 1 (families and species). Seven species were divided into six (06) observed families. The flora of this area is mainly dominated by Pinaceae and Cupressaceae, followed by Fagaceae, while Lamiaceae and Anacardiaceae are the least frequent families.
The values of H’ index vary depending on the exposure of the studied plots. It varies from 0.9±0.3 for the northern exposure to 0.5±0.3 for the western one. Simpson's Diversity Index is very small for stands with western exposure 0.4±0.3, whereas it is much larger for stands with northern exposure (0.8±0.09).
Spatial Distribution
Only Pinus halepensis Mill. trees were taken into consideration via the calculation of the aggregation index (R), the mixing index (Mi) and the diameter differentiation index (Tij).
The aggregation index (R) describes the horizontal spatial arrangement of tree positions (Pommerening 2002). It was calculated for all sixteen (16) plots. According to the aggregation index, western exposure shows the most regular tree patterns (1.6±0.1) (Figure 4). The east and south-facing stand also appears to be quite regular with 1.3±0.1 and 1.3±0.3, respectively. The R index for the north-facing plots was 1.2±0.1 as plots show only slight tendency towards regularity.
The mingling index (Mi) was calculated for each tree separately. The overall index value for the plot/stand was derived through the average indices of individual trees. When 4 nearest neighbouring trees were considered, the results showed index values ranging from 0.3 to 0.8.
The diameter differentiation index (Tij) was calculated for all trees. For the overall plot’s value it was derived as an average index of individual trees on the plot. When the 4 nearest neighbours were observed, the results showed that the diameter differentiation in the western and eastern exposures was almost the same as a very large differentiation index, 0.9±0.1 and 0.7±0.3, respectively, which in fact presented a very large differentiation (0.7<TI<1.0) because the tree with the smallest DBH is 30% thinner than that of the reference tree’s size. The (Tij) index indicates a large differentiation level in the south-facing plots with 0.6±0.2. The index value was same as the average index only in the northern exposure (0.4±0.1)
The mean distance-dependent measure of segregation (S’) by Pielou varies significantly (P<0.04) depending on the exposure of the studied plots. It varies from 0.2±0.2 for the western exposure to 0.56±0.12 for the northern exposure.
The ANOVA statistical test is significant for the diameter differentiation index (Tij) and Pielou’s segregation index (S’). On the other hand, there is no significant difference between plots in the forest in terms of the aggregation index (R') and the mingling index (Mi) (Figure 4).
DISCUSSION
The analysed stands were originally mixed Pinus halepensis Mill. stands that were developed into multi-species structures. The evolution of these stands originates from different structures that can be already noticed in terms of diversity. The tree species richness varies from 2 to 4 probably due to ecological variations, namely site and seed source. In fact, plots with more species have nearby stands of the regenerated species and the plots with fewer species are surrounded by pure Pinus halepensis Mill. stands.
Each of the four used stand structure indices quantifies spatial relations in a specific way. The aggregation index by Clark and Evans (R) observes the regularity of the spatial arrangement of trees. The species mingling index (Mi) strives to describe the biodiversity, because of the amount of different species sharing the habitat. The diameter differentiation index (Tij) observes the dimensions (DBH) of the nearest neighbouring trees and shows the level of their differentiation while coefficient of segregation (S’) by Pielou (1977) describes the degree of mixing of trees in a forest.
The Clark and Evans aggregation index (R), according to the results shown in Figure 4, would increase with the plot density. It can be said that plots with a large number of individuals are the most regular, the west-facing plots are the densest and most regular with 9260 individuals/ha (Table 1) where the index of aggregation (R) varies from 1.5 to 1.7 (Figure 4), but the stands facing east and south also seem to be regular and can be dense with 5080 and 4680 individuals/ha respectively and an aggregation index of 1.3 for both exposures. The north-facing plots are the least dense with 3720 individuals/ha and show a slight tendency towards regularity with an aggregation index equal to 1.2.
The current state of a forest may be more effectively described using the distribution of the mingling variable (Füldner 1995, Pommerening 1997, Albert 1999). The bigger the mean mingling (Mi) is, the more different tree species are intermingled. Small values indicate large groups of only one tree species and therefore segregation (Pommerening 1997). According to the findings in Figure 4 which showed that the index had values from 0 to 1 in all 16 plots, this result can be related to anthropogenic action in the study area such as the illegal cutting of Quercus ilex L. and Juniperus oxycedrus L. that were observed on all the east-facing plots. Holm oak is a symbol of strength and longevity and has been intensively exploited for heating, tannin and charcoal. It is even considered to be one of the best fire woods as it allows one of the best calorific yields. The use of Juniperus oxycedrus L. wood in the form of fence posts is widespread throughout the studied area. It can be also seen that planting in the exploited plots is necessary.
The index of diameter differentiation according to the results shown in Figure 4 failed to provide any firm conclusion about any trend. Contrary to expectations, this index perhaps increases with the age of Aleppo pine stands where the majority of which are not even-aged stands. The diameter differentiation index (Tij) for the majority of the studied stands assumed approximate values within the range from 0.3 to 1.0 for the four exposures. According to Pommerening 2002, these values represent the mean differentiation of diameters. Facing south stands that belong to the third class of differentiation (large differentiation), which means that their immediate neighbours have a diameter of 50% and mainly more than 70% of their own diameter. On the other hand, in western and eastern exposures the trees with the smallest DBH are less than 30% of the size of the neighbouring one because the diameter differentiation index for the two exposures is 0.9±0.05 and 0.7±0.3 respectively which represents a very large differentiation (0.7<TI<1.0); an average differentiation level (0.3<TI<0.5) in the northern exposure (0.4±0.2), where the tree with the smallest DBH is 50 to 70% of the reference tree’s size. Pielou's segregation index (S’) shows that Pinus halepensis Mill., Juniperus oxycedrus L. and Quercus ilex L. tend to segregate.
CONCLUSION
The results describe the reference state of Beni Oudjana forest; an "ecological state" that is determined in a quantifiable sense through the silvicultural parameters of Pinus halepensis Mill. From the findings, it can be seen that the diversity analysie as function of the horizontal and vertical spatial distribution measures are complementary. The first distribution indicates the proportion of the species present in the stand, and the second shows the way they are arranged in the horizontal plane, while the third indicates the way they are distributed in the vertical plane.
Aleppo pine forests are a natural barrier against the advance of the desert towards the north of the country. Therefore, it is very important to estimate the spatial distribution of Aleppo pine stands all over Algeria and to know their current state for the application of planting programs which are unfortunately inapplicable as the calculation of the distance between trees for the whole Algerian forest is very expensive. However, this study has shown that it could be applicable for small scales.
For a successful tree or shrub planting and for a development program to be successful, the present and future needs of the local population have to be taken into consideration. Because there is competition between agriculture, animal husbandry and wood consumption, the local population must be convinced that these programs (which only attain promising results after a few years) are necessary. The relatively high costs of some management programs and the necessary technical skills can also be obstacles. On the other hand, the lack of understanding of the role of trees and shrubs in the enrichment of the environment or the rejection of change can hinder efforts to combat desertification in the Aures region.
Author Contributions
IH conceived and designed the research, carried out the field measurements, and processed the data and performed the statistical analysis, MR-K and AM supervised the research and helped to draft the manuscript.
Funding
This research received no external funding.
Acknowledgments
The authors would like to thank the Forest Conservation of Khenchela for their support and permission to access the sites. Additional thanks to two anonymous reviewers for their valuable comments, which greatly improved the manuscript.
Conflicts of Interest
The authors declare no conflict of interest.
REFERENCES
Albert M, 1999. Analysis of thinning-induced changes in stand structure and modelling of thinnings in mixed-species stands. PhD thesis. University of Göttingen Faculty of Forestry and Forest Ecology, Göttingen, Germany, 195 p.
Bentouati A, 2006. Croissance productivité et aménagement des forêts de pin d’Alep (Pinus halepensis Mill.) dans le massif de Ouled-Yakoub (Khenchela-Aurès). PhD thesis, Université El Hadj Lakhdar-Batna, Faculté des sciences, Département d’agronomie, Algérie, 116 p.
Clark PJ, Evans FC, 1954. Distance to nearest neighbour as a measure of spatial relationships in populations. Ecology 35(4): 445–453. https://doi.org/10.2307/1931034.
Cordonnier T, Dreyfus P, Trouvé R, 2012. Quelles dimensions et quels indices d'hétérogénéité privilégier pour l'expérimentation dans les peuplements forestiers mélangés ou irréguliers? Rev For Fr 64(6): 773-788. https://doi.org/10.4267/2042/51115.
Füldner K, 1995. Describing foreststructures in mixed beech–ash–maple–sycamore stands. PhD thesis, University of GöttingenFaculty of Forestry, Göttingen, Germany, 163 p.
Gadow KV, 1993. Zur Bestandesbeschreibung in der Forsteinrichtung (New variables for describing stands of trees). Forst und Holz 48: 602-606.
Gaines WL, Harrod RJ, Lehmkuhl F, 1999. Monitoring biodiversity: quantification and interpretation. Gen. Tech. Rep. PNW-GTR-443. Portland, OR: U.S. Department of Agriculture, Forest Service, Pacific Northwest Research Statio, 27 p.
Gonçalves AC, 2003. Modelação de povoamentosadultos de pinheiro bravo com regeneração de folhosasna Serra da Lousã. PhD thesis, Universida de Técnica de Lisboa, Instituto Superior de Agronomia, Lisboa, Portugal, 232 p.
Gonçalves AC, Carvalho Oliveira A, Dias SS, 2010. Evolution in multi-species high forest stands in Serra da Lousã: diversity analysis. Silva Lusitana 18: 79-90.
Goubi M, Bentouati A, Kherchouche D, Sghaier T, 2019. Tarifs et tables de cubage d’arbres individuels du pin d’Alep, Pinus halepensis Mill., dans l’Aurès algérien. Bois et Forêts des Tropiques 339: 45-59. https://doi.org/10.19182/bft2019.339.a31715.
Hani I, Rached-Kanouni M, H Khamar, M Ammar, 2020. Study of the dynamics of natural stands of Pinus halepensis in the Beni Oudjana forest (Khenchela, Algeria). Ecology, Environment and Conservation 26(3): 21-26.
Indir K, Marjanović H, Balenović I, Szirovicza L, Paladinić E, Vuletić D, 2013. Spatial Structure Indices of Mature Pedunculate Oak Stands in NW Croatia. South-east Eur for 4(1): 13-21. http://dx.doi.org/10.15177/seefor.13-02.
Keren S, Svoboda M, Janda P, Nagel TA, 2020. Relationships between Structural Indices and Conventional Stand Attributes in an Old-Growth Forest in Southeast Europe. Forests 11(1): 4. https://doi.org/10.3390/f11010004.
Kimmins JP, 1997. Forest Ecology: A Foundation for Sustainable Management. MacMillan, New Jersey, USA, 596 p.
Lindenmayer DB, Margules CR, Botkin DB, 2000. Indicators of biodiversity for ecologically sustainable forest management. Conserv Biol 14(4): 941-950. https://doi.org/10.1046/j.1523-1739.2000.98533.x.
McElhinny C, Gibbons P, Brack C, Bauhus J, 2005. Forest and woodland stand structural complexity: Its definition and measurement. Forest Ecol Manag 218(1-3): 1–24. https://doi.org/10.1016/j.foreco.2005.08.034
Motza K, Sterbaa H, Pommerening A, 2010. Sampling measures of tree diversity. Forest Ecol Manag 260(11): 1985–1996. https://doi.org/10.1016/j.foreco.2010.08.046.
Pielou EC, 1977. Mathematical Ecology. John Wiley and Sons, New York, USA, 385 p.
Pierrat R, 1995. La typologie de peuplement: un outil pour l'évaluation de la biodiversité en forêt. In: Foresterie et Développement Durable. Actes des Deuxièmes Rencontres Forestières de L'ENGREF, 17-18 November 1995, Nancy, France, pp 209-219.
Pommerening A, 1997. Ananalysis of new approaches towards stand inventory in structure-rich forests. PhD thesis, University of Göttingen. Faculty of Forestry and Forest Ecology, Göttingen, Germany, 187 p.
Pommerening A, 2002. Approaches to quantifying forest structures. Forestry 75(3): 305–324. https://doi.org/10.1093/forestry/75.3.305.
Pommerening A, Stoyan D, 2006. Edge-correction needs in estimating indices of spatial forest structure. Can J For Res 36: 1723-1739. https://doi.org/10.1139/x06-060.
Pommerening A, Gonçalves AC, Rodríguez-Soalleiro R, 2011. Species mingling and diameter differentiation as second-order characteristics. Allgemeine Forst und Jagdzeitung 182(7–8): 115–129.
Pommerening A, Uria-Diez J, 2017. Do large forest trees tend towards high species mingling? Ecol Inform 42: 139-147. https://doi.org/10.1016/j.ecoinf.2017.10.009.
Pommerening A, Grabarnik P, 2019. Individual-based Methods in Forest Ecology and Management. Springer International Publishing Switzerland,411 p. https://doi.org/10.1007/978-3-030-24528-3.
Pretzsch H, 2009. Forest Dynamics, Growth, and Yield. In: Pretzsch H (ed) Forest Dynamics, Growth and Yield. Springer, Berlin, Heidelberg, Germany, pp 1-39. https://doi.org/10.1007/978-3-540-88307-4_1.
Rached-Kanouni M, Kara K, Khammar H, Ababsa L, 2020a. Floristic diversity and demographic structure of the Sidi R’Ghies forest. north-eastern of Algeria. Biodiversitas 21(3): 875-881. https://doi.org/10.13057/biodiv/d210304.
Rached-Kanouni M, Hani I, Bousba R, Beldjazia A, Khammar H, 2020b. Structural variability of Aleppo pine stands in two forests in northeastern Algeria. Biodiversitas 21(6): 2848-2853. https://doi.org/10.13057/biodiv/d210663.
Shannon CE, Weaver W, 1949. The Mathematical Theory of Communication. The University of Illinois Press, Urbana, Illionis, USA, 117 p.
Sylvie GF, 1998. Indices de competition en forêt dense tropicale humide: étude de cas sur le dispositive sylvicole expérimental de Paracou (Guyane française). Ann For Sci 55(6): 623-654. https://doi.org/10.1051/forest:19980601.
Tomé M, Burkhart HE, 1989. Distance-dependent competition measures for predicting growth of individual trees. Forest Sci 35(3): 816-831. https://doi.org/10.1093/forestscience/35.3.816.
© 2021 by the Croatian Forest Research Institute. This is an Open Access paper distributed under the terms of the Creative Commons Attribution License (http://creativecommons.org/licenses/by/4.0).