
![]() - Download PDF-
- Download PDF-
SEEFOR 10 (2): 125-135
Article ID: 257
DOI: https://doi.org/10.15177/seefor.19-17
ORIGINAL SCIENTIFIC PAPER
Modelling Bark Thickness of Norway Spruce (Picea abies Karst)
Jusuf Musić1, Ahmet Lojo1, Besim Balić1, Aida Ibrahimspahić1*, Admir Avdagić1, Jelena Knežević1, Velid Halilović1
(1) University of Sarajevo, Faculty of Forestry, Zagrebačka 20, BA-71000 Sarajevo, Bosnia and Herzegovina
Citation: MUSIĆ J, LOJO A, BALIĆ B, IBRAHIMSPAHIĆ A, AVDAGIĆ A, KNEŽEVIĆ J, HALILOVIĆ V 2019 Modelling Bark Thickness of Norway Spruce (Picea abies Karst). South-east Eur for 10 (2): 125-135. DOI: https://doi.org/10.15177/seefor.19-17
Received: 4 May 2019; Revised: 6 Sep 2019; Accepted: 11 Sep 2019; Published online: 3 Nov 2019
Cited by: Crossref Google Scholar
Abstract
Background and Purpose: Bark thickness and its share in the volume of roundwood are the most important characteristics of the bark, particularly in the process of timber harvesting, and during scaling of processed logs. Therefore it is very important to have at disposal relatively accurate data regarding these characteristics of bark for particular tree species. The main goal of this paper is to investigate the thickness of the bark and its share in the volume of roundwood of Norway spruce.
Materials and Methods: The research was carried out in the area of the Canton 10 of the Federation of Bosnia and Herzegovina and it encompassed 393 trees of Norway spruce from 10 cm to 115 cm of thickness at breast height. Measuring of the mean diameter and double thickness of bark was conducted by section method. In total, 4,647 diameters and bark thicknesses were measured in different relative lengths of stems or in average 10.6 measurements per one stem.
Results: As an optimal model for the evaluation of double thickness of the bark of Norway spruce depending on mean diameter of roundwood the function with designated determination coefficient of 0.7142 was selected. The obtained results have confirmed the previously defined relations of investigate characteristics, which are as following: a) with the increase of mean diameter of roundwood (section) double bark thickness is increased from 9.26 mm (thickness class 12.5 cm) to 31.65 mm (thickness class 92.5 cm); b) with the increase of mean diameter of roundwood the share of bark in its volume decreased from 14.26% (thickness class 12.5 cm) to 6.73% (thickness class 92.5 cm).
Conclusions: By the actual method of estimating bark thickness or the share of bark in the volume of roundwood of Norway spruce in the forestry of the Federation of Bosnia and Herzegovina a significant error was created which increases with the increase of mean diameter. The obtained results point to the necessity of investigation of these bark characteristics in Bosnia and Herzegovina and represent an inevitable starting point for making adequate tables of bark thickness and its percentage share in the volume of roundwood of Norway spruce.
Keywords: bark thickness, bark share, mean diameter, roundwood, relative length
INTRODUCTION
Bark is the layer of tree consisted of an external and internal part. External bark (lub) consists of the dead protection layer of the bark, and it spreads from internal bark to the peripheral layer of the tree. Internal bark (floem) includes the living part of the bark which performs physiological and protection functions, and spreads from cambial ring to the internal zone of dead bark. The importance of bark as the external layer of the trunk consists of several important aspects: (1) it provides protection for trunk growth, (2) it can be used as the source of energy or in production of special products (malch, tannin, dye, pharmaceutical products, etc.), and (3) it has impact on the realized income since technical roundwood is, as standard, delivered and sold based on volume without bark. Therefore, knowledge regarding bark thickness and the possibility of most accurate assessment of its share in the trunk and timber assortments is extremely important in the present wood trade. Inaccurate assessments may, for the forest owner, result in loss of value even up to 11% [1]. Studies on bark thickness and its percentage share in the volume of the trunk or roundwood were conducted for the needs of forest management and exploitation, and, among other things, were inspired by the progress of the commercial importance of bark from unwanted residue to important fuel and a source of bio-material of high value [2].
First studies on bark thickness and bark volume were conducted by Flurry in Switzerland at the end of the 19th century. The goal was to identify factors for the conversion of the volume of the trunk with bark into volume without bark, and it represented the beginning of some still accurate studies of bark of different tree species in many parts of the world [3]. Previous studies were mainly focused on the assessment of bark thickness at the breast height [4-6] since total volume of the trunk bark can be calculated approximately based on its thickness at breast height. However, recently researchers have more dealt with the impact of other factors on the thicknes of the bark, such as relative height of the trunk, quality of the habitat, altitude above the sea level, age, etc. [7-12].
The first comprehensive studies were conducted by Altherr et al. [13] in Baden-Württemberg. The sample covered a surface of 35.752 km2 and a very wide scope of habitat and stand conditions. Data collected from 7.712 trees resulted in identification of functional dependence of bark thickness (mm) and percentage share of bark (%) in the trunk volume for 33 tree species. Implementation of these results is recommended by Pollanschütz for Austria as well [14]. However, for the region of Tyrol, Kirschner made tables for bark thickness and its share for main tree species in Tyrol, while Güde made tables for thickness and its share of bark of spruce which can be implemented in Forstdirektion Mayr-Melnhof Frohnleiten [14].
In the area of former Yugoslavia, research on bark thickness was first conducted on deciduous tree species [4, 5, 15]. Namely, regulations on methods of measuring and identification of quantities, and regulations on methods of delivering roundwood of deciduous species have caused reasonable and justified interest for the most accurate identification of bark thickness and the percentage share in the volume of the trunk or roundwood. Studies on coniferous trees’ bark were mainly devoted to fir [16, 17]. Bark thicknes of spruce was researched in Slovenia by Turk and Lipoglavšek [18], and also by Rebula [19]. Rebula [19] obtained slightly larger values of bark thickness than Turk and Lipoglavšek [18], noting that the results should be checked by a larger sample and in locations where spruce is a more significant tree species (Alpine area). Also, Rebula [19] stated that the bark of spruce in Slovenia is thinner for 1-2 mm compared to Upper Schwabia (Germany), and that these differences are particularly expressed in thicker trees in upper parts of the trunk.
By analyzing different sources of losses in volume for roundwood of spruce due to the prescribed method of measuring in Croatia, Poršinsky and Vujeva [20] identified the deduction of double thickness of bark (from 16.9 vol. % to 5.8 vol. %) to be the source of highest loss.
For numerous coniferous species it was identified that bark thickness can be well described by the following variables: diameter with bark, total height of the trunk and measuring height [21]. For spruce it was identified that bark thickness depends on diameter with bark and relative height of the trunk, and that it is also conditioned by the age of the tree, its height and shape [9].
All studies so far have identified some generally accepted facts [22]:
- bark thickness is directly proportional to diameter of the trunk or roundwood,
- bark thickness decreases from the stump towards the top of the trunk,
- bark thickness increases with the thickness of roundwood, and its relative share in the volume decreases.
Assortment tables which are used in Bosnia and Herzegovina for the most important tree species, apart from numerous wood assortments, also contain the category "waste". From practical point of view this category can be divided to real waste and losses. Real waste in that sense consists of several unprocessed parts of large wood and sawdust, while losses are made due to prescribed methods of measuring of dimensions and identification of quantities and deducted double thickness of bark. According to the above-mentioned, it is extremely important for forest enterprises that such losses are as low as possible, or that they have at disposal the most accurate data on bark thickness of particular tree species. Evident differences in thickness of spruce bark between particular countries, even between different regions in the same country, which were identified by some authors, impose the need to research this characteristic in Bosnia and Herzegovina as well. In Sweden, for example, according to the instructions of Timber Measurement Council [23], it is recommended to use of as many as 11 different functions for the calculation of bark thickness for spruce, depending on geographical origin of the tree. This was one of the crucial motives for this research.
MATERIALS AND METHODS
Spruce (Picea abies Karst) is, from the economic and ecological aspect, one of the most important coniferous tree species in Europe. In optimal conditions it can reach the height of over 40 m and diameter of over 1 m. The bark is relatively thin and greyish. At the beginning, on young branches and young trunk the bark is smooth, and later on older trees it peels and falls off in the form of round scales and is coloured dark-reddish. Large area (Figure 1) has caused the occurrence of numerous forms variable per habitat, including branch forming, needles and cones [24]. Spruce wood is valuable construction timber, and it is also used for the production of premium veneers, different types of wood plates, in the production of cellulose, paper and other. It is also popular as a Christmas tree, and especially valuable is as resonance spruce wood for making musical instruments.
Spruce is one of the most significant forest tree species in Bosnia and Herzegovina. According to the preliminary results of the Second National Forest Inventory in Bosnia and Herzegovina, the total surface of available high forests of production character where spruce is grown amounts to 589,700 ha, where its share in the total wood stock is 16.1%. This makes it the third most important tree species in our forests (after beech and fir).
The present research was conducted in the area of Canton 10 (Figure 2), and it was financed by the Federal Ministry of Education and Science within the project "Making of bark thickness tables for fir, spruce and beech".
![]() FIGURE 2. Research area – Canton 10 of the Federation of Bosnia and Herzegovina.
FIGURE 2. Research area – Canton 10 of the Federation of Bosnia and Herzegovina.
For the purpose of objective research on impacts of different factors on which bark thickness depends only normaly formed trees were selected for the sample, or the trees without visible deformations on the trunk. On every trunk several diameters were measured, starting from the stump to the top. Distance of the diameter from the stump was expressed in relative units from total height of the trunk, or the length of the cut trunk.
In every place on the trunk (section) the following were measured:
- mean diameter outside the bark (in the middle of the section) in centimeters with accuracy down to millimeter and crossed (biggest and smallest),
- bark thickness down to millimeter accuracy, on points where diameter measuring device touches the trunk (two measurements).
During the measuring of the bark the so-called notch was made vertically to the trunk on the wood, so that bark thickness can be clearly seen and precisely measured (Figure 3). The measuring itself was performed by movable measuring device (vernier calipers). Namely, measuring by Swedish bark gauge in general overestimates its thickness since during the measurement it partially penetrates into wood, while it is also sensitive to the season of sampling [26]. Along with that, it is severely dependent on subjective feeling of the measuring technician [27] since it requires huge skill for such method of determination of bark thickness in order to be able to recognize the moment when the blade is starting to penetrate into wood [11]. Due to these reasons, which were confirmed in our trial work with this instrument, it was decided that the measurement shall be done in the described way.
Despite the importance of certain parameters, such as the method of measuring bark thickness, sample size and its distribution on the researched area, these parameters were not given adequate attention in previous literature as well [28]. Husch et al. [29] as a general rule mentioned that for the determination of factors of bark at the breast height it is necessary to provide a sample of 20 to 50 trees. Studies which research models of conical characteristics, which may include measurements of the diameter with or without bark are extremely variable. Kozak [30], for example, has analyzed the sample of over 100,000 trees and 16 tree species, while Jiang et al. [31] have covered by analysis only 18 trees of one tree species. It is of critical importance that the sample should cover variations of bark thickness in the research area with lowest possible costs [28].
The sample of this research consisted of 393 spruce trees on which 4,647 diameters and bark thicknesses were measured, or in average 11.8 measurements per one tree. In the sample trees of different sizes were selected, from 10 to 115 cm of thickness at breast height (1.30 m) and of different quality classes, according to silvicultural and technical classification [32, 33]. Trees in the area were selected in a way that their number in the sample was proportional to the total surface of forests of this tree species in Canton 10 per particular municipalities. After measuring, logical analysis of the collected data was conducted. One part of the collected data was excluded from further processing due to illogically small or large value, or in cases when measurement was not completed (some data were missing).
To express dependence of bark thickness on influential factors the method of simple and multiple regression analysis was implemented by Generalized linear models (GLM) method. The result of GLM analysis is a complex regression equation which contains parameters with particular category variables or cases within category variables. In the processing of data and interpretation of results statistical program STATGRAPHICS Centurion XVII was used.
For the calculation of percentage share of bark in the volume of the section (part of the trunk) Mayer [34] template was used. Mayer presumed that the form factor of trunks with bark is equal to form factor of trunks without bark. Based on that assumption he made the following equation for the calculation of percentage share of bark:
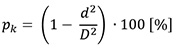
where pk is the share of bark in the volume of the section of the trunk; d is the diameter inside Bark, and D is the diameter outside bark.
RESULTS AND DISCUSSION
Bark Thickness
According to the results of conducted studies on factors which have impact on bark thickness it was presumed that bark thickness, apart from the diameter of roundwood, depends also on the point of measuring on the trunk, or on distance from the stump towards its top. This hypothesis was checked by statistical analysis of data by using GLM analysis. In the analysis the dependent variable was the double thickness of bark (Dbark in milimeters), while as independent variables the following were taken:
- mean diameter of the section (part of the trunk) – Dm section (cm) as continuous variable, and
- relative distance of diameter of the section from the stump – PARTtrunk as a category variable.
Each trunk was divided in 5 sections of equal relative lengths (PARTtrunk). The first section (1) included the lower fifth of the total length of the trunk (from stump), the second section (2) included the next fifth, etc. The fifth section (5) included the upper fifth of the length of the trunk (the thinnest).
First, by statistical analysis the normality of independent variable (Dm section) by potential transformations [35] was checked. It was identified that the distribution of original data deviates from normal, and therefore for its optimal transformation the exponent of 0.256 was designated (Figure 4).
![]() FIGURE 4. Distribution of data for independent variable before and after transformation.
FIGURE 4. Distribution of data for independent variable before and after transformation.
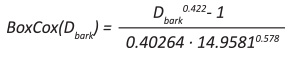
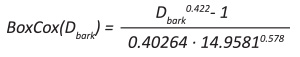
The same procedure was conducted also for the dependent variable. It was identified that for achieving approximately normal distribution the value of double thickness of bark (Dbark) also has to implement potential transformation, with the exponent of 0.4026 (Figure 5).
![]() FIGURE 5. Distribution of data for dependent variable before and after transformation.
FIGURE 5. Distribution of data for dependent variable before and after transformation.
After conducted transformations the following regre-ssion model with coefficient of multiple determination of 0.7631 was identified:
BoxCox(Dbark)=-17.317-1.782·I1(1)-1.98071·I1(2)-0.952788·I1(3)+1.08855·I1(4)+18.605·Dmsection0.256
where:
I1(1) = 1 if PARTtrunk = 1, -1 if PARTtrunk = 5,0 in other case;
I1(2) = 1 if PARTtrunk = 2, -1 if PARTtrunk = 5,0 in other case;
I1(3) = 1 if PARTtrunk = 3, -1 if PARTtrunk = 5,0 in other case;
I1(4) = 1 if PARTtrunk = 4, -1 if PARTtrunk = 5,0 in other case.
Table 1 shows the variance of the model (explained part of varying) of residual deviation (error of the model) and total variance of data on bark thickness. According to the factor F - the relation of the middle of the square in explained and unexplained part of varying (variances) it can be concluded that the selected independent variables have statistically high impact on the change of the value of dependent variable. According to the identified value of F-test, which is larger than critical according to F-distribution (Fisher-Snedecor distribution), and p-value, which is smaller than 0.05, the difference between variances is, with usual safety of conclusion of 95%, statistically important [36, 37].
![]() TABLE 1. The analysis of variance for the thickness of bark (Dbark) of the regression model.
TABLE 1. The analysis of variance for the thickness of bark (Dbark) of the regression model.
Based on the results of the analysis of the source of varying and F-relation of variances presented in Table 2 it can be concluded that the highest impact on bark thickness has the diameter of the section of the trunk (Dm section), which was expected. Also, it can be concluded also that the variable PARTtrunk (part of the trunk) has very high impact on bark thickness. That means that bark thickness at the same diameter of the section (part of the trunk) on different relative heights of the trunk is not equal.
Figure 6 shows mean thicknesses of bark for different parts of the trunk and lowest significant differences (LSD intervals) at the probability of 95%. It is visible that bark thickness is increasing from bottom towards the top of the trunk (further from the stump). That means that pieces of wood of the same diameter have thicker bark if they are closer to the top of the trunk. An exception from that rule is the first section (1) which has slightly thicker bark than the next section (2), but that difference is not significant. It can be more clearly seen from data in Table 3.
Identified impact of the variable PARTtrunk on bark thickness is very interesting, but in principle logical. In available literature this impact was researched only by Bojanin [15] for ash, but he did not identify significant difference. The results found by this research were caused primarily by laws of thickness increment of the trunk and characteristics of the spruce bark. Namely, thickness increment along the trunk of trees is different from increment at breast height. Thickness increment is the smallest at certain height of the trunk, below or above the breast height. Height of the smallest thickness increment depends on age, or thickness of the trunk and quality of the conditions of the habitat. Towards the top and towards the foot of the tree from that place (height) thickness increment increases, and it is the biggest at the top of the trunk [38]. The fact that the increase of thickness increment is also followed by the increase of bark thickness is in favor of the obtained results. Additionally, spruce bark on older trees or older parts of trees is peeling and falling off, which also results in smaller thickness.
The identified mathematical model, unfortunately, has only scientific significance and is not applicable in practice. Namely, when it comes to practical implementation of this model for the assessment of bark thickness (in measuring sizes and delivering roundwood from stock yard) most often it is unknown from which part of the trunk particular pieces are taken. Therefore, the identified model is currently not applicable in operational work withouth changes in rules and regulations for identification and marking of roundwood.
Therefore the model for the assessment of double thickness of bark was created based on only one independent variable - diameter of the part of the trunk with bark (Dm section), which in forestry practice of Bosnia and Herzegovina, with length measuring , is used as the basis for the identification of the volume of roundwood. As in the previously described procedure, the independent variable (Dm section) was used in its transformed form. For identification of optimal model of the assessment of double bark thickness depending on diameter of the section of the trunk (with bark) in the same statistical program several regression models were checked. As an optimal model, which is obtained with the transformation of dependent variable per BoxCox procedure, the following linear function was selected:
BoxCox(Dbark) = -10.7807+15.4065·Dm section0.256
where:
The unique mathematical expression of the model is:
Dbark=[(1.3612·Dm0.256 )-0.0441]2.3697
Coefficient of correlation for this model is R=0.8451, or the coefficient of determination R2=0.7142. According to this, by not including the impact factor PARTtrunk about 5% of explanation of variability of bark thickness was lost. The values of statistical indicators of significance (t-values), free member and parameter with independent variable, which are much higher than the critical size and p-value, which is much smaller than 0.05 of high statistical significance of parameters of the model were identified (Table 4).
Based on the selected model the assessed values for each input data for thickness of the section were calculated. After that real deviations (residuals) were calculated, and based on it the standard deviation of the model (SD=3.22 mm) and standard error of estimate (SEE=0.036 mm) were calculated. The relation of real values of bark thickness (Dbark) and assessed bark thickness per this regression model is presented in Figure 7.
![]() FIGURE 7.Double bark thickness of spruce depending on diameter at stem section.
FIGURE 7.Double bark thickness of spruce depending on diameter at stem section.
Analysis of residuals shows that there is no systematic deviation of it in any part of the domain of empirical data (Figure 8).
![]() FIGURE 8.Residual deviations from the double bark thickness estimation model.
FIGURE 8.Residual deviations from the double bark thickness estimation model.
By modeling the thickness of spruce bark in Germany, with similar goal to the goal in this paper, Stängle et al. [39] have used in the analysis three independent variables (diameter at breast height, relative height and diameter of the section) and obtained the model with determination coefficient of 0.76.To show the dependence of spruce bark thickness on diameter of the section (log) in Slovenia, Rebula [19] identified linear dependence with determination coefficient of 0.65. By modeling bark thickness in even-aged spruce stands depending on diameter at breast height Laasasenaho et al. [9] obtained determination coefficient of 0.66. Apart from the diameter, they also used the height and age of the tree (in logarithmic form), so determination coefficient increased to 0.77. In the analysis of fir bark thickness depending on diameter at breast height, Božić et al. [10] used variables in logarithmic form and obtained adjusted determination coefficient of 0.67%. By introducing additional variables (height, age, altitude above the sea level) the same authors identified a model with slightly larger determination coefficient of 0.7037. By studying fir bark thickness depending on mean diameter of the section Lojo et al. [12] obtained for the selected optimal model of levelling determination a coefficient of 0.758. Prka [8] obtained by modeling beech bark thickness depending on mean diameter of the piece (section) models with determination coefficient from 0.355 to 0.783, depending on the type of felling, or 0.65 for all felling together.
Based on conducted comparations with results of other authors who dealt with modeling of connection between bark thickness and diameter, it can be concluded that the selected model in this research is very good, and that its statistical parameters and assessed values of double bark thickness depending on mean diameter of the section, presented in Table 6, are very reliable.
Bark Share in the Volume of Roundwood
Bark share in the volume of the trunk or part of the trunk is also a value usable in forestry practice, since, among other things, one of the standardized ways of the reduction of volume with bark is implementation of adequate tables of the percentage of bark share in the volume. Therefore in this paper the percentage of spruce bark share in the volume of the section was calculated depending on mean diameter outside bark by using Mayer formula (Table 6). Diameters inside bark were obtained by deduction of double thickness of bark calculated by the identified mathematical model.
Data show a decrease of percentage of bark share with the increase of mean diameter, while the same relation was identified also by other authors who studied this characteristic [11, 12, 15, 17, 19]. The first reason for this relation is the fact that the increment of wood mass is higher than the increment of bark, and that the trunks (logs) of larger diameters have in percentage lower share of bark in the volume compared to thinner trunks [8].
By analyzing the results presented in Table 6 it can be seen that they are logical and that they cofirm previously established relations regarding the observed characteristics. In order to see the whole picture, the results of this paper were compared with the results of other authors. Figure 9 shows a comparative presentation of double bark thickness of spruce depending on mean diameters of the section for roundwood.
![]() FIGURE 9.Comparasion of double bark thicknesses with results of other authors.
FIGURE 9.Comparasion of double bark thicknesses with results of other authors.
The highest values of spruce bark thickness were identified by Kirschner [14], and the lowest by Rebula [19]. Rebula [19] emphasized that his sample was too small (186 sections) and that it is not sufficient for identification of certain laws, while the results of Kirchner [14] are very indicative because this author within his research obtained thicker bark for spruce compared to fir, which is a unique case. The results of this research to a large extent correlate with the results of Altherr et al. [13] and Güde [14], noting that by these studies slightly higher bark thickness in lower and lower thickness in higher thickness classes were obtained as compared to the mentioned authors.
Regarding the percentage of bark share in the volume of the part of the trunk (section), as it has already been emphasized, it decreases with the increase of mean diameter. A comparative presentation of the obtained values by the author who researched this characteristic is given in Figure 10. It is important to mention that, having in mind the method of calculation of the percentage of bark share (Mayer formula), the results are as accurate as the accuracy of assessed bark thickness.
![]() FIGURE 10.Comparasion of the share of bark in the volume of roundwood with results of other authors.
FIGURE 10.Comparasion of the share of bark in the volume of roundwood with results of other authors.
Reduction of the percentage of bark share with the increase of mean diameter of the section of roundwood is visible in the results of all analyzed authors, but it is most emphasized in Kirschner [14], who obtained the highest values of this characteristic. Values obtained in this research are in the same relation with the results by Altherr et al. [13] and Güde [14] for bark thickness as well (as it has been previously described).
The conducted studies on thickness and the percentage share of spruce bark per its scope of the sample size have been the most comprehensive so far in scientific work in Bosnia and Herzegovina. The obtained results clearly point to all lacks of the usual practice of deduction of bark in operational forestry of the Federation of Bosnia and Herzegovina. Namely, in forestry practice there are no rules or tables for the deduction of bark based on adequate scientific or expert research, but it has been, unfortunately, based on lump assessments and/or alleged experience of empolyees duing measuring and delivery. Such method of deduction of bark has multiple negative effects on business operations of forest enterprises, and it also puts certain buyers in a more favorable position than others and vice versa [12].
CONCLUSIONS
Based on the obtained results of the conducted research and discussion the following important conclusions can be drawn:
- The highest impact on bark thickness has the diameter of the section of the trunk (Dm section). Also, the variable PARTtrunk (part of the trunk) has very high impact on bark thickness, and, respectively, bark thickness at the same diameter of the section (part of the trunk) on different relative heights of the trunk is not equal.
- The obtained results on spruce bark thickness and its percentage share in the volume of the part of the trunk depending on mean diameter confirm the previously established relations, and evident differences point to the need to research these characteristics in Bosnia and Herzegovina.
- Bark thickness of spruce increases with the increase of mean diameter of roundwood (section) from 9.26 mm (thickness class 10-15 cm) to 33.65 mm (thickness class 90-95 cm). Determination coefficient of 71.42% and standard error of estimation of 0.036 mm of the selected model show that the estimated values of bark thickness are very reliable.
- Percentage share of bark in the volume of roundwood (section) of spruce decreases with the increase of mean diameter of 14.26% (thickness class 10-15 cm) to 6.73% (thickness class 90-95 cm).
- By actual method of estimating bark thickness or the share of volume of bark in the volume of roundwood of spruce a significant error is created which increases with the increase of mean diameter.
- In forestry as a branch of economy which belongs to the category of so-called mass-production the law of large numbers is present where on multi-million exampes huge losses can appear due to inappropriately prescribed method of measuring dimensions of roundwood including the deduction of double thickness of bark. Therefore it is very important that the measurements or estimations of bark thickness are conducted with as high accuracy and reliability as possible. Related to that, the obtained results represent an inevitable starting point for making adequate tables for bark thickness and its percentage share in the volume of roundwood of spruce.
Acknowledgements
The research was financed by the Ministry of Education and Science of the Federation of Bosnia and Herzegovina and on this occasion we sincerely express our gratitude to them. The authors are grateful to all employees of FMC "Hercegbosanske šume" Ltd. Kupres for unselfish assistance during the measuring of trees and the collecting of necessary data.
REFERENCES
- MARSHALL HD, MURPHY GE, LACHENBRUCH B 2006 Effects of bark thickness estimates on optimal log merchandising. For Prod J 56 (11/12): 87-92
- DORUSKA PF, PATTERSON D, HARTLEY J, HURD M, HART T 2009 Newer technologies and bioenergy bring focus back to bark factor equations. J For 107 (1): 38-43. DOI: https://doi.org/10.1093/jof/107.1.38
- STÄNGLE SM, SAUTER UH, DORMANN CF 2017 Comparison of models for estimating bark thickness of Picea abies in southwest Germany: the role of tree, stand, and environmental factors. Ann For Sci 74: 16. DOI: https://doi.org/10.1007/s13595-016-0601-2
- KLEPAC D 1957 Research about bark thickness in forests of sessile oak and pedunculate oak (in Croatian with English summary). Šum list 81 (3-4): 90-106
- KLEPAC D 1958 The relationship between the diameter over bark and the bark thickness for our most important hardwood species (in Croatian with English summary). Šum list 82 (7-9): 251-267
- MONSERUD RA 1979 Relations between inside and outside bark diameter at breast height for Douglas-fir in Northern Idaho. USDA Forest Service Research Note INT-266. DOI: https://doi.org/10.5962/bhl.title.79427
- WILHELMSSON L, ARLINGER J, SPÅNGBERG K, LUNDQVIST S-O, GRAHN T, HADENBERG Ö, OLSSON L 2002 Models for Predicting Wood Properties in Stems of Picea abies and Pinus sylvestris in Sweden. Scand J For Res17 (4): 330-350. DOI: https://doi.org/10.1080/02827580260138080
- PRKA M 2004 Bark Thickness of Common Beech (Fagus sylvatica) in cutting areas of Bilogora near Bjelovar. Šum list 128 (7-8): 391-403
- LAASASENAHO J, MELKAS T, ALDÉN S 2005 Modelling bark thickness of Picea abies with taper curves. For Ecol Manag 206 (1-3): 35-47. DOI: https://doi.org/10.1016/j.foreco.2004.10.058
- BOŽIĆ M, ČAVLOVIĆ J, VEDRIŠ M, JAZBEC M 2007 Modeling bark thickness of silver fir trees (Abies alba). Šum list 131 (1-2): 3-12
- STANKIĆ I, KOVAČ S, PORŠINSKY T 2010 Bark Features of Black Alder from Podravina. Nova mehanizacija šumarstva 31: 27-36
- LOJO A, MUSIĆ J, BALIĆ B, AVDAGIĆ A, HALILOVIĆ V, IBRAHIMSPAHIĆ A, KNEŽEVIĆ J 2019 Thickness and share of bark in the volume of fir roundwood (Abies alba) (in Bosnian with English summary). Naše šume 54-55 (in print)
- ALTHERR E, UNFRIED P, HRADETZKY J, HRADETZKY V 1978 Statistische Rindenbeziehungen als Hilfsmittel zur Ausformung und Aufmessung unentrindeten Stammholzes. Mitteilungen der Forstlichen Versuchs - und Forschungsanstalt, Baden – Württemberg , Freiburg i. Breisgau
- RÖSSLER G 2018 Estimation of bark proportion - but how? BFW - Austrian Research Centre for URL: https://bfw.ac.at/100/pdf/Vortrag_Rindenabzug_kl.pdf (4 March 2019)
- BOJANIN S 1972 Bark thickness and percentage of the narrow-leaved ash (Fraxinus angustifolia ) roundwood (in Croatian with English summary). Šum list 96 (7-8): 267-277
- BOJANIN S 1966 The thickness of the bark at different height above the ground for fir tree (in Croatian with English summary). Drvna industrija 17 (4-5): 76-85
- KLEPAC D 1972 Research of the thickness and volume of bark for fir in various phytocenoses (in Croatian with French summary). Glasnik za šumske pokuse 16: 105-122
- TURK Z, LIPOGLAVŠEK M 1972 The volume and weight of bark in relation to the diameter of fir, spruce and beech in certain regions of Slovenia (in Slovenian with German summary). Institute of Forest and Wood Economy of Slovenia, Ljubljana, Slovenia, 68 p
- REBULA E 1994 Uncertainty of Determining the Volume of Coniferous Round Timber with Proposal for a Measurment Procedure. Mehanizacija šumarstva 19 (2): 87-110
- PORŠINSKY T, VUJEVA J 2007 Volume losses of processed spruce roundwood due to prescribed method of scaling. Nova mehanizacija šumarstva 28 (1): 37-47.
- LI R, WEISKITTEL AR 2011 Estimating and predicting bark thickness for seven conifer species in the Acadian Region of North America using a mixed-effects modeling approach: comparison of model forms and subsampling strategies. Eur J For Res 130 (2): 219-233. https://doi.org/10.1007/s10342-010-0423-y
- KRPAN APB 1986 Bark of the beech from the standpoint of forest exploitation. Miscellanea of Coloquy about the beech – The Conference of the assistents section, Velika, Hrvatska, 22-24 November 1984. Forestry Faculty of University Zagreb, Zagreb, Croatia, pp 77-88
- SWEDICH TIMBER MEASUREMENT COUNCIL 1999 Regulations for measuring of roundwood. VMR 1-99
- JOVANOVIĆ B 1985 Dendrology. University of Belgrade, Faculty of Forestry, Belgrade, Serbia, 557 p
- EUFORGEN 2013 Distribution map of norway spruce (Picea abies). URL: http://forest.jrc.ec.europa.eu/media/atlas/Picea_abies.pdf (26 March 2019)
- ALTHEN FW 1964 Accuracy of the Swedish bark measuring gauge. For Chron 40 (2): 257-258. DOI: https://doi.org/10.5558/tfc40257-2
- MESAVAGE C 1969 Measuring bark thickness. J For 67 (10): 753-754. DOI: https://doi.org/10.1093/jof/67.10.753
- STÄNGLE SM, WEISKITTEL AR, DORMANN CF, BRÜCHERT F 2016 Measurement and prediction of bark thickness in Picea abies: assessment of accuracy, precision, and sample size Can J For Res 46 (1): 39-47. DOI: https://doi.org/10.1139/cjfr-2015-0263
- HUSCH B, BEERS TW, KERSHAW JA 2003 Forest Mensuration. 4th Ed., John Wiley & Sons, Hoboken, New Jersey, USA, 443 p
- KOZAK A 2004 My last words on taper equations. For Chron 80 (4): 507-515. DOI: https://doi.org/10.5558/tfc80507-4
- JIANG L, BROOKS JR, WANG J 2005 Compatible taper and volume equations for yellow - poplar in West Virginia. For Ecol Manag 213 (1): 399-409. DOI: https://doi.org/10.1016/j.foreco.2005.04.006
- MATIĆ V 1964 Method of the Forest Inventory on large areas – part I and II (Manuscript). Institute for Forestry of the Faculty of Forestry in Sarajevo, Bosnia and Herzegovina
- LOJO A, BEUS V, MEKIĆ F, KOPRIVICA M, MUSIĆ J, TREŠTIĆ T, BALIĆ B, ČABARAVDIĆ A, HOČEVAR M 2008 Method of the Second Forest Inventory on large areas in Bosnia and Herzegovina (in Bosnian with English summary). Works of the Faculty of Forestry University of Sarajevo 20 (1): 1-156
- MEYER H 1946 Bark volume determination in trees. J For 44 (12):1067-1070. DOI: https://doi.org/10.1093/jof/44.12.1067
- BOX GEP, COX DR 1964 An Analysis of Transformations. J Roy Stat Soc B Met 26 (2): 211-252. DOI: https://doi.org/10.1111/j.2517-6161.1964.tb00553.x
- HADŽIVUKOVIĆ S 1973 Statistical methods. Forum, Novi Sad, Serbia
- SNEDECOR GW, COCHRAN WG 1971 Statistical methods (in Serbian). Vuk Karadžić, Beograd, Serbia, 511 p
- MATIĆ V 1980 Forest growth and yeild. University of Sarajevo, Faculty of Forestry, Bosnia and Hezegovina, 351 p
- STÄNGLE SM, NAKOI A, BRÜCHERT F, SAUTER UH, KOHNLE U 2014 Modeling Bark Thickness of Norway Spruce. Sustaining Forests, Sustaining People: The Role of Research, Abstracts of XXIV IUFRO World Congress, 5-11 October 2014, Salt Lake City, USA, 427 p
© 2019 by the Croatian Forest Research Institute. This is an Open Access paper distributed under the terms of the Creative Commons Attribution License (http://creativecommons.org/licenses/by/4.0).