
SEEFFOR 4 (1): 13-21
DOI: http://dx.doi.org/10.15177/seefor.13-02
Original scientific paper
Spatial Structure Indices of Mature Pedunculate Oak Stands in NW Croatia
Krunoslav Indir 1*, Hrvoje Marjanović 2, Ivan Balenović 2, Lajos Szirovicza 3, Elvis Paladinić 2,
Dijana Vuletić 2
1 Croatian Forest Research Institute Varaždin, Croatia
2 Croatian Forest Research Institute Zagreb, Croatia
3 Institute for Anthropological Research Zagreb, Croatia
* Corresponding author: e-mail:
Citation:
INDIR K, MARJANOVIĆ H, BALENOVIĆ I, SZIROVICZA L, PALADINIĆ E, VULETIĆ D 2013 Spatial Structure Indices of Mature Pedunculate Oak Stands in NW Croatia. South-east Eur for 4 (1): 13-21. DOI: http://dx.doi.org/10.15177/seefor.13-02
Cited by: CrossRef Google Scholar
Abstract
Background and Purpose: In order to potentiate a valid comparison of forest stands, numerous indices were developed to express forest structure numerically. Each of those indices described a specific measured or calculated value. In the present study, three of the stand structure indicators, dependent on tree distance, were used: the aggregation index of Clark and Evans, the species mingling index and the diameter differentiation index. The objectives of this study were: to obtain further information about forest structure using the selected indices and to discover any limitations that the implemented indices might display.
Materials and Methods: Mature pedunculate oak stands were selected as objects of the study, all located within the “Repaš – Gabajeva Greda” forest management unit, the Forest Administration of Koprivnica. The stands were aged 75 to 132 years. A systematic 500 m grid of 45 circle sample plots was established. The sample plot radius was 15, 25 or 30 meters, depending on the stand’s age. In 2001, the DBH (diameter at breast height) and tree positions in regard to the centre of a plot were measured on each sample plot. The mutual distances between trees were calculated, as well as the values of the three selected stand structure indices. The two procedures of the aggregation index of Clark and Evans were calculated for all 45 sample plots. In the first case only the pedunculate oak trees were observed, and in the other all trees on the plot. The species mingling index and the diameter differentiation index were calculated for each tree in two procedures: in relatio to three and four nearest neighbouring trees. The plot/stand totals were managed as the average index of individual trees.
Results: Values of the aggregation index of Clark and Evans after all trees have been observed were from 0.89 to 1.28, which indicated a random distribution of trees. In case of considering only pedunculate oak trees, the index of the plots was 1.02 to 1.51. This indicated a tendency to a regular distribution of trees. The species mingling index that considered three nearest neighbouring trees was 0.395 to 0.620. When observing four nearest neighbouring trees, the index values showed slight decreases in all age classes. The diameter differentiation index (0.407-0.424) when three or four nearest neighbour trees were taken into account, showed almost the same differentiation in the 5th, 6th and 7th age class.
Conclusion: Though they contained the component of distance between the trees and were based on individual trees parameters, the three analysed stand structure indicators were a useful tool in further categorizing of forest stands.
Keywords: forest structure, spatial tree arrangement, stand structure indices, pedunculate oak
INTRODUCTION
The word structure has multiple meanings: the interior component parts arrangement within a whole, a set of interdependent parts, organisation, a manner of composing components or particular immutable details into a whole [1]. All of these meanings may be used entirely even for defining the forest structure. Many Croatian authors suggested their definitions of forest structure and discussed them in the scientific literature of forestry.
The authors Pranjić and Lukić [2] concluded: “The term stand structure implies species distribution, tree number and tree dimension distribution per unit area. The stand structure is the result of the simultaneous growth intensity of each tree species exposed to human and natural influences”.
The stand structure was directly or indirectly studied in research done by Matić [3], Pranjić and Lukić [4], Lukić [5], Božić [6], Novotny [7], Novotny et al. [8, 9], Dubravac [10], Marjanović [11], Marjanović et al. [12].
Many authors in the world were also studying and defining the stand structure. Some of them will be mentioned here.
Oliver and Larson [13] defined forest structure as a physical and chronological distribution of trees in the stand. The simple definition by Kimmins [14] is that stand structure is its vertical and horizontal tree arrangement. Pommerening [15] gave an overview of three main stand structure aspects and units that may describe them (Figure 1).
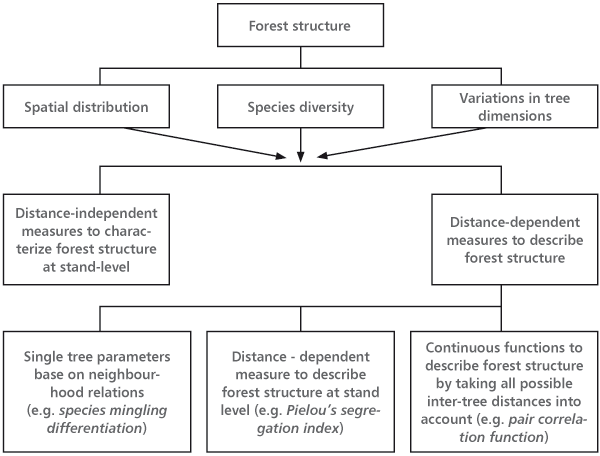
FIGURE 1. The overview of the three major characteristics of forest structure and the groups of variables by which forest structure was assessed (Pommerening [15] modified from Albert [16])
In the present study, three of the distance-dependent stand structure indicators were used: the aggregation index of Clark and Evans, the species mingling index and the diameter differentiation index. The aggregation index of Clark and Evans (CEI) represents the relationship of the observed and the expected mean distance between the nearest neighbouring trees. CEI equal to 1 indicates a random distribution of trees. If CEI is greater than 1, it points to a tendency of a regular tree distribution. CEI values lower than 1 indicate an aggregated distribution of trees.
The species mingling index and the diameter differentiation index observe the reference trees and at least three (or four) of their nearest neighbours. Such a group of trees is called a structural group of four (Figure 2).
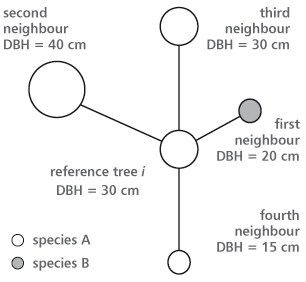
FIGURE 2. A structural group of four for calculating the species mingling and the DBH differentiation index (Pommerening [15] modified after Albert and Gadow [17])
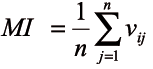
The species mingling index (MI) gives the proportion of three or four nearest neighbouring trees that do not belong to the same species as the reference tree (Figure 2). The stand’s condition may be described by using the distribution of the mingling variable [15]. When at least three nearest neighbouring trees are selected, four possible results may be assumed (0.00; 0.33; 0.67; 1.00). With four neighbours, there are five possible results (0.00; 0.25; 0.50; 0.75; 1.00). The overall mingling index for the stand (sample plot) is defined by the average value of all reference trees. The bigger the mean mingling, the more different tree species are intermingled. Lower values are pointing to segregation [18].
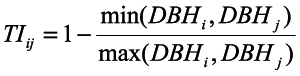
The diameter differentiation index (TI) indicates the range of the difference in size of the neighbouring trees and describes the spatial distribution of tree sizes. The possible values of the index are between 0 and 1. If the index assumes the value 0, it means that the neighbouring trees have the same diameter as the reference tree. The overall diameter differentiation index for the stand (sample plot) is defined by the average value of all reference trees. According to Pommerening [15], values may be classified and interpreted as below:
- a small differentiation level (0.0<TI<0.3) – the tree with the smallest DBH is 70% or more of the reference tree’s size;
- an average differentiation level (0.3<TI<0.5) – the tree with the smallest DBH is 50 to 70% of the reference tree’s size;
- a large differentiation level (0.5<TI<0.7) – the tree with the smallest DBH is 30 to 50% of the reference tree’s size;
- a very large differentiation level (0.7<TI<1.0) – the tree with the smallest DBH is thinner than 30% of the reference tree’s size.
The objects of the present study were some mature pedunculate oak stands, all belonging to the phytocenosis of Carpino betuli – Quercetum roboris /Anić 1959/ emend. Rauš 1969. The specified phytocenosis is present in the lowlands forest cover in the Republic of Croatia. The habitat is out of the reach of floods, the fact proved by the appearance of the common hornbeam.
The sample plots were set up in the stands that were 75 to 132 years old in 2001. In the overall area of the managed high forests classified into a pedunculate oak management class in the Republic of Croatia, the most common are the 5th and 6th age classes (age 81 to 120), contributing 41% [19].
The goals of this study were: to give a methodology overview for the selected indices, to use them to obtain further information about the forest structure and to perceive any limitation that implemented indices might display.
MATERIALS AND METHODS
Field Measurements
The data used in this study were collected from 45 sample plots located in the Repaš – Gabajeva Greda forest management unit. The sample plots were set and measured from April 7, 2000 to February 13, 2001. The location of the samples was determined by the North-South (East-West) oriented, 500 m square grid, laid over the entire surface of the observed area (Figure 3).
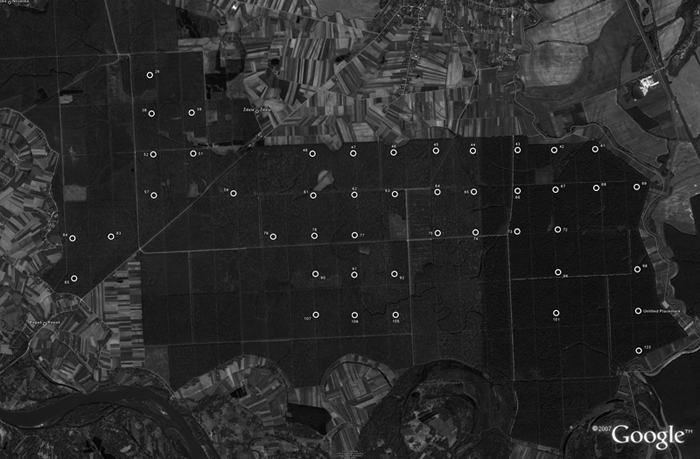
FIGURE 3. The position of the plots in the research area (the Repaš – Gabajeva Greda management unit)
Each tree on the sample plot was measured, starting from the north, and moving clockwise within the specified radius of the plot.
The measured attributes were:
- the distance between the centre of the plot and each tree (in meters, with the precision of 1 decimetre),
- the azimuth of each tree (in degrees),
- each tree’s DBH (two cross values measured in the north-south and east-west direction (in millimetres).
The distance from the centre of the plot to each tree was measured by a 50 m long measuring tape and rounded to 1 dm. The length was taken from the left side of the vertical axis of each particular tree, observed from the centre.
The azimuth of the vertical axis for each tree was set by a precise geodetic compass with a bubble level and rounded to 1 degree. All trees were numbered. The tree nearest to the north direction was numbered as 1. Further numeration proceeded clockwise.
For each tree, two DBH values at the right angle were measured, using the Haglof caliper in millimetres, with the precision of 1 mm.
The first DBH was measured by caliper arms tangent to the west and east surface of the trunk, i.e. the caliper arms were directed north-west. The second DBH was taken perpendicular to the first one, with caliper arms tangent to the north and south side of the trunk.
Data analysis
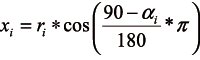
The average DBH of each tree was derived as an arithmetic mean of two perpendicular measured values, with the precision of 1 mm. The position of each tree was defined by the measured azimuth and distance values. Since for the selected indices the calculation of the distance between individual trees was required, this stand element was derived as well. In the plane with the origin in the centre of the sample plot, the coordinates xi and yi of the i-th tree were calculated using the following formulas (Equation 1, 2):
(1)
(2)
ri – the distance from the i-tree to the centre of the plot (m),
αi– the azimuth of the i-tree (°).
The Euclidean distance between two trees (Disti-j) was derived with a formula for the distance between two points on a plane (Equation 3):
(3).
For each individual sample plot, the aggregation index of Clark and Evans (CEI) was calculated, with no correction for edge effects, in two instances. In the first case there were only pedunculate oak trees taken into consideration. All trees were considered in the second approach. This was the way of finding out the aggregation degree of oak trees in the upper part of the stand regarding the overall aggregation index when all trees were considered.
(4)
(5)
CEI – the aggregation index of Clark and Evans,
robserved – the mean distance from the tree to the nearest neighbouring tree on the plot,
E(r) – the expected mean distance to the nearest neighbouring tree,
N – tree number,
A – the area of the plot.
The species mingling index was calculated for each individual tree (Equation 6). The index value of the plot/stand was an average of the particular indices.
MI ε (0,1) (6)
MI – the species mingling index
n – the number of nearest neighbouring trees (3 or 4)
vij = 1, if the reference tree i and the neighbour
j are different tree species
vij = 0, otherwise
To each particular tree and for the sample plot in total, there were two species mingling indices calculated, taking into account 3 or 4 nearest neighbouring trees.
The diameter differentiation index (TIij) describes the spatial distribution of tree diameters. For the reference tree ‘i’ and its n=3 or the 4 nearest neighbouring trees, ‘j’ the diameter differentiation index (TIij) was defined as shown below (Equation 7):
TIij ε (0,1) (7).
The numerator was always the lower of the two observed diameters (the reference tree’s DBH and n-th the neighbour’s DBH) and the denominator was always the greater. The index value was increasing with the increase of the neighbouring trees’ mean DBH difference. The index was 0 when the observed trees had the same diameter.
The overall plot diameter differentiation index was calculated by adding all individual tree indices together and then dividing this total by the number of values, so that the result was the average TIij. For each individual tree, two diameter differentiation indices were calculated: considering 3 or 4 nearest neighbouring trees.
RESULTS
In 2000, 4668 trees were measured on sample plots, 1514 of which were pedunculate oak, and 2339 were common hornbeam. The rest of the measured trees on the plots were less frequent species: field maple, elm, narrow-leafed ash, black alder and other hardwood.
The aggregation index of Clark and Evans was calculated for all 45 plots in two procedures. Only pedunculate oak trees (CEI_L) were taken into account by the first calculation, and all trees present on the plot (CEI_S) were considered by the other (Table 1).
TABLE 1. The aggregation index of Clark and Evans by 20-year age classes
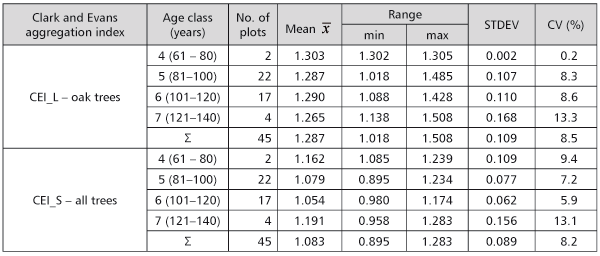
When all trees were observed, the aggregation index of Clark and Evans values was 0.89 to 1.28, what pointed to the nearly random spatial tree arrangement.
When only pedunculate oak trees were considered, the index on plots was 1.02 to 1.51, as there was a tendency to a spatial distribution regularity (Table 1). As the age of the stand increased, no tendency of a significant increase of the index value was present. According to the linear regression model, the index value was 1.29 (Figure 4). It lead to the conclusion that pedunculate oak trees in the observed stands, even in the age of 70, reached the spatial distribution regularity which they tend to keep until the rotation ends.
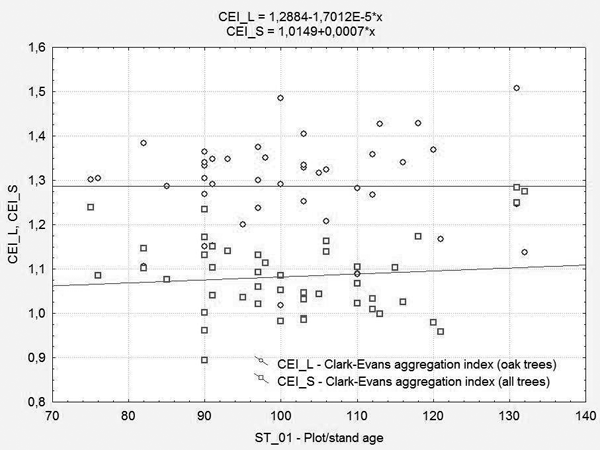
FIGURE 4. The Clark and Evans aggregation index values according to the plot/stand age
The species mingling index in its formulation for 3 or 4 nearest neighbouring trees examined the probability of the nearest tree being the same tree species as the reference tree. The index was 0 and 1. When none of the nearest trees belonged to the tree species of the central tree, the index was 1 at the most. When all the neighbouring trees were different species, the index value was 0. The index was calculated for each tree separately. The overall index value for the plot/stand was derived through average indices of individual trees.
When three nearest neighbouring trees were considered, the results shown by the 20-year age classes were index values from 0.395 to 0.620 (Table 2).
TABLE 2. The species mingling index by the 20-year age classes
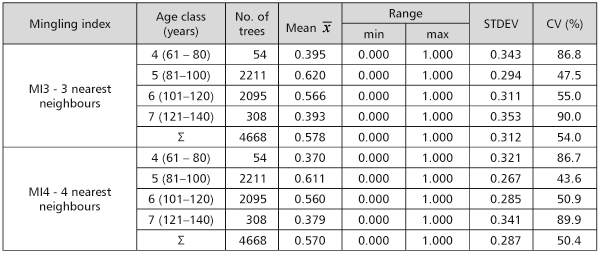
Variation coefficients were high, particularly for age classes that had less sample plots. When 4 nearest neighbours were considered, the index values and the coefficient of variation decreased slightly in all age classes (Table 2). The sample plots from the 4th and 7th age class had significantly lower index values, what points to a lower species diversity. According to the fact that in the 4th age class there was a plot with a small share of common hornbeam trees, this result confirmed it.
The mean value of the species mingling index for all 45 plots (all age classes) was 0.570 when 3, and 0.594 when 4 neighbours were taken into account. The majority of the sample plots indices were between 0.6 and 0.8.
The diameter differentiation index was calculated for all trees. For the overall plot its value was derived as an average index of individual trees on the plot. As it was the case with the species mingling index, there were two approaches: calculations with 3 and 4 nearest neighbouring trees.
When three nearest neighbours were observed, the results by the 20-year age classes showed that the diameter differentiation in the 5th, 6th and 7th age class was almost the same as the average index (0.407 to 0.424). That presented an average differentiation (0.3<TI<0.5) because the tree with the lowest DBH was 50 to 70% of the reference tree DBH. The index value was lower only in the 4th age class (0.299). Almost the same situation was when the 4 nearest neighbouring trees were taken into consideration. Consequently, there was no significant DBH difference among the stands in the age of 81 to 140 (Table 3).
TABLE 3. The DBH differentiation index values by the 20-year age classes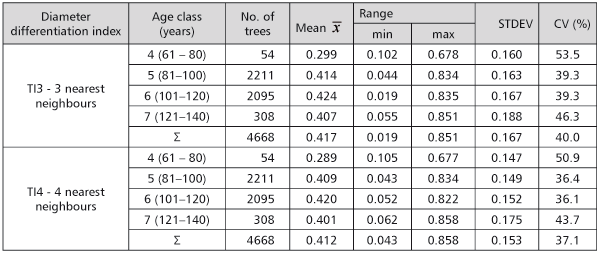
The mean diameter differentiation index value for all 45 sample plots (all age classes) was 0.415 with the 3 nearest neighbours considered, and 0.425 when the 4 nearest neighbours were considered.
DISSCUSION
Each of the three used stand structure indices quantifies spatial relations in a specific way. The aggregation index of Clark and Evans observes the regularity of the spatial arrangement of trees.The species mingling index strives to describe the biodiversity, because of the amount of diffe-rent species sharing the habitat. The diameter differen-tiation index observes the dimensions (DBH) of the nearest neighbouring trees and shows the level of their differentiation.
The results of the aggregation index of Clark and Evans, calculated for all 45 plots, showed that the index had values from 0.89 to 1.28 and displayed a slight tendency for further growth (Figure 4).
However, when the spatial arrangement of only pedunculate oak was observed, then the values of the aggregation index showed a higher spatial regularity. With the increase of the stand age to 130 years, the values were practically the same (the equalization line had an insignificant gradient). The conclusion is that mature pedunculate oak trees in the observed stands, achieved the amount of spatial regularity to be maintained until the end of the rotation, to their age of 70 years. The results obtained by the present study were relatively comparable with the study of Marjanović et al. [12], that observed the trend of that index in mature pedunculate oak and common hornbeam stands of the central Croatia. The results of this study indicated that the index had the range of values from 0.8 to 1.2. That pointed to a random spatial arrangement of trees when all trees in the stand were observed. According to Marjanović, the trend of a slightly increased regularity in older stands was irrelevant.
Stoyan and Pentinnen [20] observed stands in different development phases, and concluded that old stands had a tendency to a random spatial arrangement of trees.
The reliability of the results was significantly higher with a correction for edge effects [21].
The species mingling index according to the results shown in Table 2 failed to provide any firm conclusion about any trend. Contrary to expectations that this index would increase by age, the trend of index values was unnoticeable, and the high variability affected the results when common hornbeam and other tree species were present. By aging, the number of pedunculate oak trees decreased and thereby the probability of hornbeam trees as the nearest neighbouring trees increased. The same goes for other associated tree species that had a large number of thin trees. The diameter differentiation index for the majority of the studied stands assumed approximate values within the range from 0.40 to 0.42 for the 5th, 6th and 7th age class (20-year age classes). According to Pommerening [15] those values represent the mean differentiation of diameters. The index remained within the same range of values with very slight differences, regardless of whether three or four nearest trees were considered, or the 10-year or 20-year age classes. Slightly lower values (0.29) in the 4th age class, where diameter differences among trees were less prominent, may be explained by a smaller range of the DBH values in younger stands. The conclusion was that the stands stabilized their structure in the border age range between the 4th and 5th age classes, so further diameter differentiation index values did not significantly change.
The species mingling and the diameter differen-tiation indices were both using the method of three or four nearest neighbours for the calculations.The imperfection of this approach became evident in the case of large distances between the trees, when their interaction was doubtful, as small distances between the trees implied their strong interaction. Pommerening [15] pointed to the convenience of the method that uses three or four nearest neighbours, in case of measuring only specific nearest tree distances, without recording positions for all trees. That is why the method of taking samples through a structural group of four was developed(Figure 2). This particular method gave an insight into the forest structure at minimal cost.
The indices of species mingling and diameter differentiation may be derived even from the sample plots commonly used in the present forest inventory. In that case, rather than tree diameters, the distance between the nearest trees in relation to the referent tree should be measured.
The three indices of the forest structure studied in this paper may be used as an additional indicator of the stand structure, because in this way apparently imperceptible differences in spatial relations among the forest tree species may be expressed. The studied indices may be applied as tools for the stand comparison as well.
The 10-year age classification was not proven as a step forward in reviewing the trends of the calculated indices. That was partly the result of inaccurate stand/plot age data and because of the relatively small structure differences in mature stands that were studied as well. The use of common 20-year age class width was satisfying in the specified context.
The necessity of knowing the spatial distribution of trees on the plot (in the stand) makes the three indices observed here less applicable in the forest practice. Measurement and calculation of tree distances makes the whole procedure more expensive, and may be applicable only to small scale studies.
The absence of any corrections for edge effects was a disadvantage of all tree indices. The calculated nearest neighbour for a tree standing near the edge of the sample plot was not necessarily the effective nearest neighbour. A distortion of the correct index value may arise as a result. It should, however, be emphasized that the error caused by edge effects was bigger when small sample plots were researched, and that the edge effect correction for the aggregation index of Clark and Evans was not valid in case of circular plots [22].
More intensive processes of growth and deve-lopment in younger pedunculate oak and common hornbeam stands would certainly show more significant changes in the observed indices, than some mature stands. This may partially be concluded even from the research of Marjanović [11], and should be a subject for further studies.
CONCLUSIONS
The calculated values of the aggregation index of Clark and Evans showed mostly random spatial distribution of trees in the observed pedunculate oak stands. When only pedunculate oak trees were taken into consideration, that index was greater than 1.51 for all plots which pointed to a tendency of a regular tree distribution. The pedunculate oak trees in the observed stands, even in the age of 70, had the amount of tree distribution regularity that was going to be held until the end of the stand’s rotation.
The species mingling index on the plots showed values that allowed no firm conclusions about the trend in mature stands. The diameter differentiation index by age classes indicated very small differences among the values, regardless of whether three or four nearest trees were considered. It meant that at the age of about 80 years, the stands stabilized to the level after which there should be no significant changes in the relation among the pedunculate oak and associated tree species DBHs.
The three of the applied stand structure indices should be a useful tool in further categorizing forest stands, because of the tree distance component integration and their individual tree parameters basis.
REFERENCES
- ANIĆ V, GOLDSTEIN I 1999 Rječnik stranih riječi. Novi Liber, Zagreb, p 1496
- PRANJIĆ A, LUKIĆ N 1997 Izmjera šuma (Forest mensuration). Faculty of Forestry, University of Zagreb, Zagreb, p 405 (in Croatian)
- MATIĆ S 1996 Silviculture treatments in regeneration of Pedunculate oak stands. In: Klepac D, Dundović J, Gračan J (eds) Pedunculate oak (Quercus robur L.) in Croatia. Croatian Academy of Science and Arts (Vinkovci Center for Scientific Work), “Croatian Forests” Public Company, Zagreb, pp 426-439
- PRANJIĆ A, LUKIĆ N 1989 The increment of pedunculate oak trees as an indicator of environmental changes. Glas šum pokuse 25: 79-94 (in Croatian with English summary)
- LUKIĆ N 1990 Utjecaj strukturnih promjena jednodobnih bukovih sastojina na visinski i debljinski prirast. Dissertation, Faculty of Forestry, University of Zagreb(in Croatian)
- BOŽIĆ M 2003 The impact of site and stand elements on the increment of silver fir (Abies alba Mill.) in fir stands on the Croatian karst. Dissertation, Faculty of Forestry, University of Zagreb, p 190 (in Croatian with English summary)
- NOVOTNY V 1998 Change/shift of bacis stand elements in the period between two measurings in a community of Carpino betuli-Quercetum roboris /Anić 1959/Rauš 1969. Rad -Šumar inst Jastrebar 33 (1): 1-46 (in Croatian with English summary)
- NOVOTNY V, SELETKOVIĆ A, DUBRAVAC T 2001 Stand structure as the main indicator in the elaboration of management plans. In: Žihlavník A, Marušák R (eds) “Present and new ways of development of forest management” The problems of spatial arrangement of the forest and cutting control at the present time.
Zvolen, Slovakia, pp 101-106 - NOVOTNY V, DUBRAVAC T, SELETKOVIĆ A, INDIR K 2006 Research of diameter structure of peduncled oak and common hornbeam (Carpino betuli-Quercetum roboris Anić ex. Rauš 1969.). Rad -Šumar inst Jastrebar (special issue) 9: 263-278 (in Croatian with English summary)
- DUBRAVAC T 2002 Regularity of growth of crown structures of peduncled oak and common hornbeam depending on dbh and age in Carpino betuli-Quercetum roboris Anić ex Rauš 1969 community. Dissertation, Faculty of Forestry, University of Zagreb, p 196 (in Croatian with English summary)
- MARJANOVIĆ H 2009 Modeling tree development and elements of stand structure in young stands of Pedunculate oak (Quercus robur L.). Dissertation, Faculty of Forestry, University of Zagreb, p 213 (in Croatian with English summary)
- MARJANOVIĆ H, DUBRAVAC T, INDIR K, IVANKOVIĆ M 2006 Quantitative Estimators of Structure in Chosen Stands of Common Oak and Hornbeam (Carpino betuli - Quercetum roboris Anić 1959/em. Rauš 1969). Rad -Šumar inst Jastrebar 41 (1-2): 107-113 (in Croatian with English summary)
- OLIVER C D, LARSON B C 1990 Forest Stand Dynamics. McGraw-Hill, New York, p 467
- KIMMINS J P 1997 Forest Ecology. Macmillan Inc., New Jersey, p 596
- POMMERENING A 2002 Approaches to quantifying forest structures. Forestry 75 (3): 305-324. DOI: http://dx.doi.org/10.1093/forestry/75.3.305
- ALBERT M 1999 Analyse der eingriffsbedintgten Struktur-wervaenderungen und Durchforstungsmodellierung in Mischbestaenden. Dissertation, Faculty of Forestry and Forest Ecology, University of Goettingen, Hainholz Verlag Goettingen, p 195
- ALBERT M, GADOW KV 1998 Assessing biodiversity with new neighbourhood-based parameters. In: Iaumonier Y, King B, Legg C, Rennolls K (eds) Data Management and Modelling Using Remote Sensing and GIS for Tropical Forest Land Inventory, Proceedings of the FIMP-INTAG International Conference. Jacarta, Indonesia, pp 433-445
- POMMERENING A 1997 An analysis of new approaches towards stand inventory in structure-rich forests. Dissertation, Faculty of Forestry and Forest Ecology, University of Goettingen, Cuvillier Verlag Goettingen, p 187 (in German with English summary)
- CROATIAN FORESTS LTD 2006 Forest management plan of the Republic of Croatia (2006-2015) (in Croatian)
- STOYAN D, PENTTINEN A 1998 Spatial Point Process Methods in Forestry Statistics. Technical University Freiberg, Faculty of Mathematics and Informatics, p 66
- FÜLDNER K 1995 Zur Strukturbeschreibung in Mischbest-änden. Forstarchiv 66: 235-240
- KINT V, LUST N, FERRIS R, OLSTHOORNA FM 2000 Quan-tification of forest stand structure applied to scots pine (Pinus sylvestris L.) forests. Invest. Agr.: Sist. Recur. For.: Fuera de Serie n.º 1-2000
© 2015 by the Croatian Forest Research Institute. This is an Open Access paper distributed under the terms of the Creative Commons Attribution License (http://creativecommons.org/licenses/by/4.0).