
![]() - Download PDF-
- Download PDF-
SEEFOR 6 (2): 201-217
Article ID: 73
DOI: https://doi.org/10.15177/seefor.15-19
Original scientific paper
Black Locust (Robinia pseudoacacia L.) Root Cuttings: Diversity and Identity Revealed by SSR Genotyping: A Case Study
Maria Emilia Malvolti 1*, Irene Olimpieri 1, Paola Pollegioni 1, Klára Cseke 2, Zsolt Keserű 3, Károly Rédei 3
1 National Research Council of Italy (CNR), Institute of Agro-Environmental and Forest Biology (IBAF), Via Guglielmo Marconi 2, I-05010 Porano, Italy
2 National Agricultural Research and Innovation Centre, Forest Research Institute, Department of Tree Breeding, Várkerület 30/A, HU-9600 Sárvár, Hungary
3 National Agricultural Research and Innovation Centre, Forest Research Institute, Department of Plantation Forestry, Farkassziget 3, HU-4150 Püspökladány, Hungary
* Corresponding author: e-mail:
Citation:
MALVOLTI ME, OLIMPIERI I, POLLEGIONI P, CSEKE K, KESERŰ ZS, RÉDEI K 2015 Black Locust (Robinia pseudoacacia L.) Root Cuttings: Diversity and Identity Revealed by SSR Genotyping: A Case Study. South-east Eur for 6 (2): 201-217. DOI: https://doi.org/10.15177/seefor.15-19
Received: 30 Apr 2015 / Accepted: 28 Aug 2015 / Published online: 6 Oct 2015
Cited by: CrossRef (2) Google Scholar (3)
Abstract
Background and Purpose: Black locust (Robinia pseudoacacia L.) is a valuable species native to North America and today widely planted throughout the world for biomass production. In Hungary, where Robinia has great importance in the forest management, the clones have been selected for plantations on good, medium and poor quality sites. To conserve the identity, superior clones are vegetatively propagated by root cuttings. At times the collection of root cuttings can cause uncertainty for clonal identity because of the overlap of roots from neighboring plants. This can occur especially when the repository is damaged from severe environmental accidents and the planting layout has been lost. The aim of this study has been to verify by molecular markers the diversity or identity of black locust clones by root cuttings harvested in a damaged trial.
Materials and Methods: Root cuttings of 91 clones belonging to five cultivars were collected in a trial severely damaged by storms and flooding periods. The obtained plantlets were analyzed with nine microsatellite (SSR) markers and the genetic identity/diversity within and among the plants was tested using the software GenAlEx version 6.
Results: Multilocus genotypes (MLG) and the Paetkau’s assignation test (1985) revealed genetic variability among the samples: the analyzed plantlets were grouped in four classes instead of the five expected. In addition, 6 unique genotypes have been detected.
Conclusions: This study remarks problems that may arise during the harvest of Robinia’s root cuttings, especially when the planting layout has been confused. Molecular analyses can be successfully used to control the germplasm before its sale as guaranty for nurseries, farmers and stakeholders.
Keywords: Black locust (Robinia pseudoacacia L.), vegetative propagation, molecular markers, microsatellites, genotyping
INTRODUCTION
Black locust (Robinia pseudoacacia L.) is a nitrogen-fixing leguminous tree, widely spread over the temperate regions of the world because of its rapid growth and adaptability to environmental stress such as low-fertility soils [1]. The species, native to North America, was the first forest tree species introduced and acclimated to Europe in the 17th century where, at present, it can be considered naturalized [2]. Although in some European countries Robinia is still considered alien and invasive, in other regions it is appreciated for arboriculture [3], [4] as a tree species which is fast growing and multipurpose for various production (fuel and quality wood, fodder, poles, honey) [5], [6], [7] .
In Hungary, black locust covers approximately 24% of the forest area and provides about 19% of the annual timber output [8]. Since 1960s, many cultivars have been selected and certified [9], [10] for quality wood production and exported to many countries for arboriculture plantations. Hungary possesses one of the most abundant black locust germplasm repositories in the world. The clonal cultivations aim not only to improve the timber quality and apiary purport, but also to produce biomass, to establish short rotation plantations, to mitigate the effect of global climate change and to contrast soil erosion [8].
Black locust genotypes can be multiplied by seed and by root cuttings. Seed propagation is easy and cheap, but seed-raised plants often present great genetic variation unsuitable for cultivars [11]. Propagation from root cuttings is suitable for the reproduction of individuals and cultivars because superior traits can be preserved in the clones. However, the production of clones of Robinia by root cuttings demands utmost care and attention because the root system forms a complex grid with frequent overlapping from nearby clones. A sampling error could cause the propagation of an unselected genotype; this is an important concern where the conservation of gain by clonal selection is necessary. Recently, 12 new Hungarian clones of black locust have been identified for superior form, wood quality for industry and for their ability to tolerate different environmental conditions [8]. These clones, commonly regenerated by root cuttings, can be sold to farmers for short rotation forestry in poor and difficult soils. The source of clones is conserved in plots at the Hungarian Forest Research Institute, (Kecskemét, HU) and is available to satisfy the increasing requirements of international forest markets.
During the last ten years, Hungary has been affected by difficult environmental conditions (http://www.eurometeo.com). The Kecskemét repository has been strongly affected by strong storms and snow, soil flooding and summer dryness. Several plots have been seriously damaged and many trees have been eradicated. In these conditions trial management was difficult, expensive, and the reservoir of clones was abandoned for 6 years. Recently, an increasing request of selected certified clones from international countries has been received, and the repository of Kecskemét has been considered again for collection of germplasm. The damage caused by adverse past weather conditions appeared so serious that the planting layout was beyond recognition. Thus, the identification and the collection of root cuttings from a required genotype was particularly uncertain.
Molecular markers are tools commonly employed for fingerprinting analysis of humans, animals and plants. Several biochemical (Isozymes) and molecular markers (RAPDs, ISSR) have been applied to black locust for population genetic studies, genome mapping and marker-assisted selection in a broad sense [12], [13], [14], [15], [16]. Microsatellites, also known as Simple Sequence Repeats (SSRs), are neutral co-dominant markers, widely dispersed in eukaryotic genomes and highly variable. SSRs are specific sequences of DNA nucleotides which contain tandem repeats of 2-6 base pairs. The length of the repeated unit is the same for the majority of the repeats within an individual SSR locus, but the number of repeats for a specific locus may differ, resulting in alleles of varying length. A vast amount of data emerging for SSR markers across organisms makes microsatellite analysis a widely accepted tool for identifying individuals, clones, cultivars. SSRs have been developed and applied in black locust to differentiate genets, ramets, and provenances [1], [18], [19], [20], [21].
This study was carried out to investigate involuntary putative mistakes during the collection of root cuttings in a damaged clonal repository. Contextually, the research aimed to verify the regeneration efficiency of roots collected in a troubled plantation. We have applied nine SSR molecular markers to test the identity/diversity of black locust plantlets generated from root cuttings collected at the foot of clones belonging to 5 cultivars, respecting the planting layout valid before the storms.
MATERIALS AND METHODS
Root cuttings of five black locust cultivars, suitable for plantation in low-fertility soils, were chosen for molecular investigation. Clones were located and collected in the experimental field trial of the Hungarian Forest Research Institute, Kecskemét City, Kiskunság region, Hungary (Lat: 46°54’22”N; Long: 19°41’28”E; elevation 120 m a.s.l.). Until the beginning of the 19th century, the region presented large pastures, then abandoned because of the overgrazing. Currently, concentrated reforestation and the planting of fruit and vines have been installed to stabilize the sandy soil. The characteristic weather in the Kiskunság region is continental warm, dry, sometimes extreme, but the amount of sunlight makes it possible to grow agricultural crops. The warmest month in Kecskemét is July (mean T 20.9°C), the coldest is January (-1.9°C); early spring and late autumn frosts are frequent. During the last ten years serious storms affected the territory and the repository was damaged: many plants fell, roots of the neighboring sprouted, and the mixing of the original plantation plots occurred. Clones belonging to specific cultivars are therefore difficult to be identified, while the collection of material certified for farmers and nurseries is not secure.
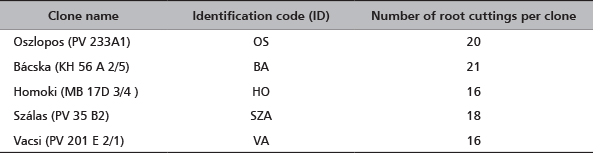
Ninety one black locust’s root cuttings of five cultivars were sent to CNR-IBAF, Porano (Italy) in November 2012 (Table 1). They were immediately planted in numbered pots (one root per pot) containing ¾ garden soil and ¼ sand; the pots were placed in greenhouse at 25°C, 70% humidity and natural photoperiod for three months. At the beginning of June 2013 the pots have been transferred outdoors. In July 2013, young leaves were collected from each sprouted plantlet and stored at -80°C until the genetic analysis was conducted. The list of the clones with the identification codes and the number of root cuttings per each clone are reported in Table 1.
TABLE 1. A list of the analyzed clones (each group of clones corresponds to one cultivar), identification codes and the number of root cuttings per each clone. To obtain plantlets each root cutting was planted in different pots (1 root-1 pot). The pots were labeled with the ID code of clone followed by the number of root (eg OS01, OS02,….OS20). The sprouted plantlets conserved this own labeling.
Originally the clones were distributed in blocks 6 m × 3 m; each block corresponding to one cultivar. Actually, the spatial distribution of clones is uncertain because of the above described complex situation of the experimental field. Thus the collection of root cuttings followed the original schema of plantation, and they were sampled where the mother plants were sited. Because of this incertitude, we have considered the obtained plantlets as one artificial population (group) putatively divided into 5 small sub-groups.
Genomic DNA was extracted and purified using the DNeasy96 Plant Kit (QIAGEN) according to the manufacturer’s instructions and stored at -20°C. The DNA in the samples is brought to a working concentration of 5 ng∙µL-1. Nine unlinked microsatellite loci (Rops02, Rops04, Rops05, Rops08, Rops09, Rops10, Rops15, Rops16, Rops18 [18], [19] are used to characterize the samples (Table 2). Polymerase chain reaction (PCR) is performed using 15 ng of DNA template, 10 mMTris-HCl (pH=8.0), 50 mMKCl, 1.5 mM MgCl2 reaction buffer, 200 µM dNTP (each), 0.008 µg BSA, 0.2U of Taq polymerase (Roche Applied Science), 0.5 µmol fluorescently labelled M13 forward primer [NED-M13(-21) primer NED-5’-TGTAAAACGACGGCCAGT-3’ [22], [23], 0.5 µmol reverse primer, 0.1 µmol M13-tailed forward primer in a total volume of 10 µl. The reactions were performed in a GENEAmp 9700 Thermocycler according to the following procedure: an initial denaturation at 94°C for 5 min, followed by 10 cycles of touchdown PCR, each consisting of denaturing at 94°C for 30 sec, 90 sec at 63°C decreasing by 1°C per cycle, elongation at 72°C for 30 sec; followed by 20 cycles at 94°C for 30 sec, 90 sec at the optimum annealing temperature for each primer pair, and 30 sec at 72°C and a final extension step at 72°C for 10 min. PCR amplification fragments were resolved by capillary electrophoresis with an ABI PRISM 3100 Genetic Analyzer (Applied Biosystems). A 500 bp internal-lane size standard (Gene Scan TM -500 ROX, Applied Biosystems) was used. The resulting data were collected using Gene Scan Analysis version 3.7 software and genotype profiles were assigned with Genotyper version 3.7 NT software (Applied Biosystems).
TABLE 2. A list of the 9 nuclear microsatellite loci [18], [19] applied for the analysis of 27 black locust plantlets sprouted from the root cuttings. For each locus the sequence, the repeat length, the annealing temperature, the resulted size range and the number of alleles are reported.

The identity/diversity within and among sub-groups was tested using the software GenAlEx version 6. [24]. Descriptive statistics including allele frequencies, the total number of the observed alleles (Na), the effective number of alleles (Ne) [25], [26] expected heterozygosity (He) and Shannon information index (I) were computed for each sub-group. The Shannon diversity index is widely used in ecology but less in clonal diversity because it is subject to sampling variance [27]. The index I, calculated on a single locus basis (I = ∑pi∙lnpi, where ln is the natural logarithm and pi is the frequency of the ith allele), provides a measure of allelic and genetic diversity. The number of private alleles for a single sub-group and the number of common alleles (ƒ>=5%) within each sub-group were counted. For each sub-group, the frequency of private alleles at each locus and the number of private genotypes were determined. Genotype data were used to assess the number of different multilocus genotypes in the group of 27 individuals: the genotype probability has been calculated for each multilocus genotype considering the frequency of each allele in the genotype (pi) and the number of heterozygous loci (h) (Genotype probability = product(pi2)2h). To verify the affiliation of the genotypes to the five candidate sub-groups, the frequency based assignment test of Paetkau [28], [29] was performed. This approach removes the individual being assigned (leave one out procedure), computes the allelic frequencies in all candidate groups, calculates the likelihoods of the individual’s multilocus genotypes occurring in each group (the independence of loci), and assigns the individual to the group with the highest log-likelihood (for instance, the group showing the least negative log-likelihood value). The statistical threshold was calculated simulating 1,000 genotypes by the novel Monte Carlo resampling method [29]. We converted likelihoods from negative to positive values by multiplying by -1, thus the samples were assigned to the group with the smallest value. To estimate the probability that two unrelated individuals drawn from the same group would have the same multilocus genotype, the Identity (PI) and Exclusion Probability (PExc) were also calculated.
PI (PI = 2(∑pi2)2-∑pi, where pi is the frequency of the ith allele) represents the probability of two individuals sharing the same multilocus genotype by chance (rather than because they are clones) and is calculated for each of the five sub-groups for individual loci and for all loci together. PExc accounts for the average mismatching probability for any genotype. Because our group of samples is artificially constructed, we have computed PExc assuming the absence of both parents for each individual [30]. PI and PExc are also indicators of the statistical power of the loci we use and provide the minimum number of loci necessary for reliable genetic tagging. Finally, the Software NTSYS pc version 2.1 [31] was used to calculate the standard biased genetic distance among 27 individuals according to Nei’s algorithm [32]. Considering the small size of our sample, we chose Nei’s biased estimation [33]. The cluster analysis has been also carried by the software NTSYS.
RESULTS
Not all root cuttings in the pots give rise to plants by the end of July, thus the number of obtained plantlets was not the same for each clone. Of 91 root cuttings, only 27 plantlets were obtained, demonstrating that the sampled tissues had a low sprouting percentage (30%). The clone BA was the most recalcitrant as only two plantlets were obtained from the 21 transplanted root cuttings (9.5% sprouting). From 16 root cuttings of the clone VA we obtained 15 plants (94.0% sprouting); among the five tested clones VA showed the highest percent sprouting. Sprouting percentages of the other three clones were low: 25.0% for HO (4 plants), 16.6% for SZA (3 plants) and 15.7% for OS (3 plants). Over five clones, nine microsatellite loci showed a different number of alleles (with different frequencies) ranging from 3 (primer Rops04) to 8 (primers Rops02, Rops09 and Rops15) with a size range from 86 bp to 237 bp (Table 2).
The indices of genetic diversity (Figure 1 and Table 3) demonstrated variable levels of heterozygosity among the sub-groups: the lowest value (He=0.167) for the sub-group OS, the highest for OH (He=0.559). In agreement, Ne ranged from 1.333 observed for OH to 2.438 for the sub-group SZA which also presented the highest number of alleles (Na=2.778). Although some private alleles were observed for all five sub-groups, SZA showed the highest number (11 private alleles) (Table 4) with a mean frequency of 1.222 (Table 3). The highest number of alleles in common among the sub-groups was detected for OH (frequency=1.222) (Table 3, Figure 1).
TABLE 3. The mean of gene diversity indices detected across the five R. pseudoacacia sub-groups (in brackets Standard Error (SE) values)
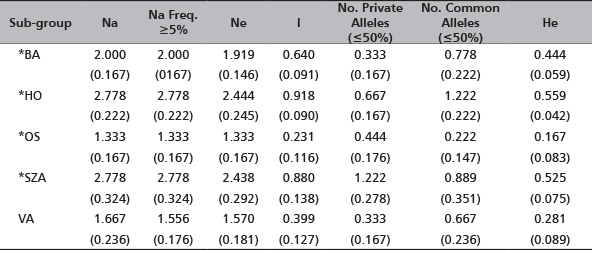
*sample size less than 5 plants
Na - No. of alleles; Na Freq. ≥5% - No. of different alleles with a frequency ≥5%; Ne - No. of effective alleles, Ne=1/(Sum pi2); I - Shannon's Information Index, I=-1∙Sum(pi∙Ln(pi)); No. Private Alleles (<=50%) = No. of alleles unique to a single population; No. Comm Alleles (<=50%) - No. of locally common alleles (Freq.≥5%) found in 50% or fewer sub-groups; He - expected heterozygosity, He=1-Sum pi2

Na - number of alleles; Na Freq. ≥5% - number of different alleles with a frequency ≥5%; Ne - number of effective alleles, Ne=1/(Sum pi2); I - Shannon's Information Index, I=-1∙Sum(pi∙Ln(pi)); No. Private Alleles - number of alleles unique to a single sub-group; No. LComm Alleles (≤25%) - No. of locally common alleles (Freq.≥5%) found in 25% or fewer sub-groups; No. LComm Alleles (≤50%) - No. of locally common alleles (Freq.≥5%) found in 50% or fewer sub-groups; He - expected heterozygosity, He=1-Sum pi2
FIGURE 1. Mean values of the gene diversity indices accounted across five Robinia pseudoacacia tested sub-groups.
Sub-groups OH and SZA showed high values of the Shannon Information index (0.918 and 0.880, respectively). However, we should remark that all scored values of genetic diversity in this study should be treated with caution since the sample size for all sub-groups, except VA, is less than 5 plants. By considering our samples as components of one artificial group, on the basis of the allele frequencies, the frequency of an expected genotype at each locus was calculated across loci and log-transformed and converted to a positive value to provide the log likelihood value (Table 5). The Paetkau’s frequency method of assignment revealed 96% of samples assigned to the original sub-groups; only sample SZA16 (4%) was assigned to sub-group VA. In order to have a graphical representation of the relationship among the genotypes, the results of the assignment test are plotted in Figure 2.

FIGURE 2. Frequency based test of assignement [28] to assign the genotypes to clusters: an individual is assigned to the group for which it has the highest likelihood. The graph is obtained by plotting the values reported in Table 5.
TABLE 4. Frequencies of the private alleles detected at the corresponding locus per sub-group
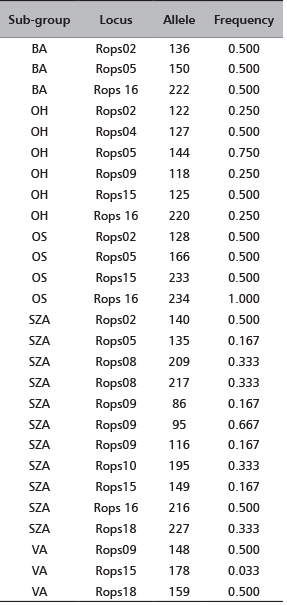

FIGURE 3. Probability of identity (PI) - for each locus and for increasing combinations of the 9 Loci (R.= Rops)
Samples OS3, OS14, OS2 and SZA16 occupy a position close to the sub-group of VA samples. Increasing the number of loci, the probability that two unrelated individuals would share the same genotype (PI) decreases (Figure 3). Four loci (Rops02+Rops04+Rops05+Rops08) are sufficient to exclude a sample from sub-groups BA, OH and SZA (PI values 3×10⁻²; 2.7×10⁻²; 5.4×10⁻³, respectively) but not enough to differentiate between sub-groups OS and VA. A multilocus genotype with seven loci (Rops02+Rops04+Rops5+ Rops08+Rops09+Rops10+ Rops15) could be used to differentiate a member among all sub-groups. The probability of exclusion (P3Exc) was calculated assuming that the samples had no parent pairs in common, results already appreciable by the combination of 5 loci (R.02+R.04+R.05+R.08+R.09). For sub-groups SZA and OH, additional loci did not remarkably increase the probability of exclusion (Figure 4). These results were in agreement with the assignment tests. Putative new sub-groups (or maybe clones) based on repeated multilocus genotypes (MLG) are detected for the 27 analyzed plantlets (Table 6). Despite our initial hypothesis of five clones, four new sub–groups were detected and labeled with different letters. The most consistent cluster included all fourteen VA samples except one (frequency of VA MLG on the total samples=51%). The other sub-groups were obtained by grouping samples OS3, OS2 and OS14 (frequency 11.1%), OH3 with OH15 (frequency 7.4%) and SZA8 with SZA17 (frequency 7.4%). In addition, six unique outsider genotypes were detected, each representing 3.7% of the total (Table 6, Figure 5).

FIGURE 4. Probability of exclusion (P3) - excluding a putative parent pair for each locus and for increasing combinations of the 9 loci (R.=Rops)
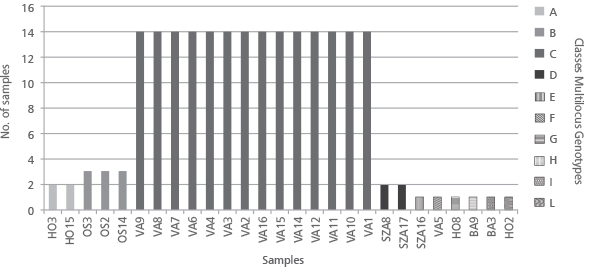
FIGURE 5. The representation of the repeated matching Multilocus Genotypes (MLG) that may represent ramets of the same clone/genet. The 27 analyzed plantlets are clustered in a total of 4 classes. In addition, 6 private multilocus genotypes have been identified.

FIGURE 6. UPGMA cluster based on Genetic Distance coefficient [32] calculated for 27 Robinia pseudoacacia multilocus genotypes obtained with 9 SSR loci.
TABLE 5. Frequency based test of assignement [28] to assign the genotypes to the five candidate or to other sub-groups following the "leave one out" procedure. (A) Assignment values with the log-likelihoods converted to positive. The lowest value indicates the most likely group (gray boxes). (B) Summary of the number of samples assigned to "self-candidate" or different sub-group.

TABLE 6. Putative clones based on repeated multilocus genotypes (MLG) detected for the 27 samples, arbitrary clustered in a unique group, using 9 SSR loci. The matching MLG, listed first, are labeled with letters. The number of samples showing the same MLG has been indicated as well as the MLG frequency. Single MLG, listed at the end of the table, are labeled with numbers.

UPGMA (Unweighted Pair Group Method with Arithmetic Mean) dendrogram obtained from the matrix of genetic distance [32] calculated for the 27 multilocus genotypes and 9 SSR loci (Figure 6) revealed two main clusters: the first including genotypes BA3, BA9, HO2, HO8, HO15, and HO3, the second containing the rest of the material except OS14, OS2 and OS3. The absence of genetic distance within the genotypes HO15 and HO3, most of the plants from VA excluding VA5, SZA17 and SZA8, and OS14, OS2 and OS3, may indicate their clonal origin. The genetic distance detected between the genotypes in BA3 and BA9 (Dist=1.80), within the two plants HO2 and HO8 (Dist=0.90), and among this sub-group with the sub-cluster HO15-HO3 (9.01), may demonstrate that the plants have different origins despite their supposed clonal origins. The same situation was observed for the plant VA5 (genetic distance from the rest of VA genotypes of 0.90). An erroneous attribution could be the reason of the separation of SZA16 from the other SZA plants.
DISCUSSION
Our study has been carried out for the genotyping of plantlets of Robinia raised from root cuttings of five selected mother plants located in a damaged experimental trial. The bad condition of the trial and the loss of the original field layout caused unsure information about the relationship of the sampled roots to a peculiar mother clone. In addition, under controlled conditions, a low percentage of sprouting by the root cuttings was obtained, and the number of the analyzed plantlets was limited. Nevertheless, our study provided useful results.
First, the low percentage of root cuttings germination verifies that without a previous appropriate treatment not all roots of black locust can generate plantlets [21], [34]. Barret et al. [6] reported that black locust can be vegetatively propagated from shoots and root cuttings, but success rates vary among clones; our data confirmed this knowledge and highlighted the importance of the quality of the materials. This evidence should be considered for practical purposes in nursery industry and in the trade of clones. The second important aspect is the problematic harvest of the root cuttings. We have analyzed plantlets raised from roots supposedly belonging to five clones (five selected mothers), and we expected five clusters, each one showing homogeneous multilocus genotypes. However, we observed genetic variability within the assumed clones. We detected four main groups instead of five and six plants with unique independent genotypes. These results may be due to different reasons. Black locust is a plastic species with a large environmental adaptability [12]; it is subject to frequent mutations and has high somatic instability [19]. This characteristic, observed in other species as well, has been found mainly for vegetative material propagated in vitro [35], [36]. However this explanation seems not appropriate for our samples since they were not obtained from in vitro cultures or somatic embryogenesis but from root cuttings collected directly in field. Thus, in normal conditions, they should have genotypes identical to the respective mother tree. The second possible explanation for the observed variability within plantlets could be an involuntary error during the sampling step. It is well known that black locust has an extensive, fibrous root system. It is quite weak, fine and shallow, but the roots extend radially from 1 to 1.5 times tree height [37]. Accidental sampling of roots from an adjacent tree, with roots that overlap the desired clone, is an obvious possible source of error in propagation. Considering the difficult condition of the plantation where our samples have been collected, the displacement of undesired genotypes, due to the sprouting of neighboring cultivars, can be supposed. We should also consider that the high out-crossing rate and the limited seed dispersal [38] could generate to roots from progenies of neighbor clones or wild genotypes. Obviously, the probability of error during the collection of roots cuttings will increase in a damaged plantation, where it is difficult to distinguish mother trees from suckers and seed progenies. The sampling of related plants could explain why several common alleles are found in more than 50% of the groups and why the Paetkau’s assignation test (Figure 2) clustered three OS samples and the plant SZA16 with the sub-group VA. However, without a larger sample it is hard to know if the presence of alleles at high frequency represents a high level of relatedness or simply a random assortment. We can presume that the original population does not have a large number of founders, so some alleles could be commonly based on genetic drift. In Hungary, black locust has a long tradition of cultivation in short rotation plantations established using seedlings. Rédei [39] reports that seeds are harvested by sifting about 10 cm of soil under selected clones that are themselves derived from previous seedling progeny trials. This method, useful and fast, allows the collection of large quantities of (mostly) half-sib seeds. Although the resulting progenies may be similar morphologically, they are likely to be genetically diverse. We could assume that the root cuttings collected and analyzed in this study are from plants obtained by this method. The above procedure could also explain the result of the cluster UPGMA that showed two different and genetically distant groups and variability within the sub-clusters (Figure 6).
CONCLUSION
Our study points to the need for genetic confirmation of the identity of clones, selected by breeders and nursery enterprises, not only before the sale to farmers, but also after plantation. Indeed, certified clones are also important in mosaic clonal plantations designed to avoid failures due to the narrowing of the genetic base (monoclonal culture) [40]. Ritchie [41] reports that the identification of unique or off-type individuals within a mixed plantation is very difficult unless each tree is labeled. It means that it is difficult to identify a maladapted clonal genotype when it is scattered throughout the plantation, and removing it from the production base could be difficult. Similarly, it can be difficult to identify a certain clone with special performance.
Special care should be applied to the collection of black locust root cuttings because of the overlapping of the root system from different plants. This is particularly important when the material is devoted to the agricultural market for farmers. However, in spite the attention, collection errors could happen especially in damaged field trials, and the identity of clones could be unsure. Molecular tests may support traditional breeding to resolve questions about the identity of ramets for trade avoiding regrettable mistakes, and for farmers to obtain sustainable wood plantations using certified clones. Our study shows that molecular markers can be successfully employed for the early and post selection of clonal material.
Acknowledgements
The study was carried out in frame of a bilateral cooperation project between CNR-IBAF and HAS-HFRI launched between 2010 and 2012. In 2013, K. Rédei (HFRI) took a study trip at CNR-IBAF, Porano, Italy subsided by the Italian Ministry of Foreign Affairs, Rome and the Hungarian Scholarship Board, Budapest, Hungary. A special thank goes to Dr. Keith Woeste (U.S.D.A. Forest Service, HTIRC, Department of Forestry and Natural Resources, Purdue University, USA) and to Dr. Peter J. Smallidge (Department of Natural Resources, Cornell University, Ithaca, USA) for the revision of the manuscript.
REFERENCES
- DINI-PAPANASTASI O, PANETSOS CP 2000 Relation between growth and morphological traits and genetic parameters of Robinia pseudoacacia var. momophylla D.C. in northern Greece. Silvae Genet 49 (1): 37-44
- SABO AE 2000 Robinia pseudoacacia Invasions and Control in North America and Europe. Restoration and Reclamation Review 6 (3). URL: http://conservancy.umn.edu/bitstream/handle/11299/59729/6.3.Sabo.pdf?sequence=1
- GRÜNEWALD H, BÖHM C, QUINKENSTEIN A, GRUNDMANN P, EBERTS J, VON WÜHLISCH G 2009 Robinia pseudoacacia L.: A Lesser Known Tree Species for Biomass Production. Bioenerg Res 2 (3): 123-133. DOI: http://dx.doi.org/10.1007/s12155-009-9038-x
- BÖHM CH, QUINKENSTEIN A, FREESE D 2011 Yield prediction of young Black locust (Robinia pseudoacacia L.) plantations for woody biomass production using allometric relations. Ann For Res 54 (2): 215-227
- KERESZTESI B 1988 The Black locust. In: Keresztesi B (ed) Forestry Monograph-Series of the Agricultural Science Department of the Hungarian Academy of Science. Akadémiai Kiadó, Budapest, Hungary, 197 p
- BARRETT RP, MEBRAHTU T, HANOVER JW 1990 Black locust: a multi-purpose tree species for temperate climates. In: Janick J, Simon JE (eds) Advances in new crops, Proceedings of the first national symposium ‘New crops: research, development, economics’, Indianapolis, IN, USA, 23-26 October 1988. Timber Press, Portland, OR, USA, pp 278-283
- HANOVER JW 1990 Physiological genetics of Black locust (Robinia pseudoacacia L.): a model multipurpose tree species. In: Werner D, Mólle P (ed) Fast Growing Trees and Nitrogen Fixing Trees. International Conference, Marburg, Germany, 8-12 October 1989, pp 175-183
- RÉDEI K, CSIHA I, KESERU˝ ZS, KAMANDINÉ VÉGH A, GYO˝RI J 2011 The silviculture of Black locust (Robinia pseudoacacia L.) in Hungary: a Review. South-east Eur for 2 (2): 101-107. DOI: http://dx.doi.org/10.15177/seefor.11-11
- KERESZTESI B 1974 Some problems in the development of Hungarian forestry (in Hungarian). Agrártudományi Közlemények 33 (24): 285-301
- MÁTYÁS CS 1979 Results in breeding of certain tree species (in Hungarian). Az Erdo˝ 28 (3): 124-127
- DINI-PAPANASTASI O, PANETSOS CP 1994 Vegetative propagation of Robinia pseudoacacia L. Cahiers Options Méditerranéennes 4: 85-91
- MAJOR A, MALVOLTI ME, CANNATA F 1998 Comparison of isozyme and RAPD variability of black locust (Robinia pseudoacacia L.) clones selected for silvicultural objectives. J Genet Breed 52 (1): 49-62
- CHOI H-K, LUCKOW MA, DOYLE J, COOK DR 2006 Development of nuclear gene-derived molecular markers linked to legume genetic maps. Mol Genet Genomics 276 (1): 56-70. DOI: http://dx.doi.org/10.1007/s00438-006-0118-8
- GUO W, LI Y, GONG L, LI F, DONG Y, LIU B 2006 Efficient micropropagation of Robinia ambigua var. idahoensis (Idaho Locust) and detection of genomic variation by ISSR markers. Plant Cell Tiss Org 84 (3): 343-351 DOI: http://dx.doi.org/10.1007/s11240-005-9043-5
- HUO X, HAN H, ZHANG J, YANG M 2009 Genetic diversity of Robinia pseudoacacia populations in China detected by AFLP markers. Front Agric China 3 (3): 337-345. DOI: http://dx.doi.org/10.1007/s11703-009-0034-x
- GU J, YANG M, WANG J, ZHANG J, LIANG H, JIA L 2010 Genetic diversity analysis of black locust (Robinia pseudoacacia L.) distributed in China based on allozyme markers. Front Agric China, 4 (3): 366-374. DOI: http://dx.doi.org/10.1007/s11703-010-1023-9
- LIAN C, ZHOU Z, HOGETSU T 2001 A simple method for developing microsatellite markers using amplified fragments of inter-simple sequence repeat (ISSR). J Plant Res 114 (3): 381-385. DOI: http://dx.doi.org/10.1007/PL00014001
- LIAN C, HOGETSU T 2002 Development of microsatellite markers in Black locust (Robinia pseudoacacia) using a dual-suppression-PCR technique. Mol Ecol Notes 2 (3): 211-213. DOI: http://dx.doi.org/10.1046/j.1471-8286.2002.00213.x-i2
- LIAN C, OISHI R, MIYASHITA N, HOGETSU T 2004 High somatic instability of microsatellite locus in a clonal tree, Robinia pseudoacacia. Theor Appl Genet 108 (5): 836-841. DOI: http://dx.doi.org/10.1007/s00122-003-1500-0
- MISHIMA K, HIRAO T, URANO S, WATANABE A, TAKATA K 2009 Isolation and characterization of microsatellite markers from Robinia pseudoacacia L. Mol Ecol Resour 9 (3): 850-852. DOI: http://dx.doi.org/10.1111/j.1755-0998.2008.02306.x
- SUNG-CHEOL J, MATSUSHITA N, BING-YUN W, NAMIKO K, SHIRAISHI A, HOGETSU T 2009 Reproduction of a Robinia pseudoacacia population in a coastal Pinusthunbergii windbreak along the Kujukurihama Coast, Japan. J For Res-JPN 14 (2): 101-110. DOI: http://dx.doi.org/10.1007/s10310-008-0109-1
- SCHUELKE M 2000 An economic method for the fluorescent labeling of PCR fragments. Nat Biotechnol 18: 233-234. DOI: http://dx.doi.org/10.1038/72708
- BOUTIN-GANACHE J, RAPOSO M, RAYMOND M, DESCHEPPER CF 2001 M13-tailed primers improve the readability and usability of microsatellite analyses performed with two different allele-sizing methods. BioTechniques 31 (1): 1-3. URL: http://www.biotechniques.com/multimedia/archive/00011/01311bm02_11392a.pdf (10 February 2015)
- PEAKALL R, SMOUSE PE 2005 GENALEX V6: Genetic Analysis in Excel. Population genetic software for teaching and research. . Mol Ecol Notes 6 (1): 288-295. DOI: http://dx.doi.org/10.1111/j.1471-8286.2005.01155.x
- KIMURA M, CROW JF 1964 The number of alleles that can be maintained in a finite population. Genetics 49 (4): 725-738
- GREGORIUS HR 1978 The concept of genetic diversity and its formal relationship to heterozygosity and genetic distance. Math Biosci 41 (3-4): 253-271. DOI: http://dx.doi.org/10.1016/0025-5564(78)90040-8
- ARNAUD-HAOND S, DUARTE CM, ALBERTO F, SERRÃO EA 2007 Standardizing methods to address clonality in population studies. Mol Ecol 16 (24): 5115-5139 DOI: http://dx.doi.org/10.1111/j.1365-294X.2007.03535.x
- PAETKAU D, CALVERT W, STIRLINGI, STROBECK C 1995 Microsatellite analysis of population structure in Canadian poplar bears. Mol Ecol 4 (3): 347-354
- AETKAU D, Slade R, Burden M, EstoupA 2004 Genetic assignment methods for the direct, real-time estimation of migration rate: a simulation-based exploration of accuracy and power. Mol Ecol 13 (1): 55-65. DOI: http://dx.doi.org/10.1046/j.1365-294X.2004.02008.x
- Jamieson A, Taylor SC 1997 Comparisons of three probability formulae for parentage exclusion. Anim Genet 28 (6): 397-400. DOI: http://dx.doi.org/10.1111/j.1365-2052.1997.00186.x
- ROHLF FJ 2000 NTSYS-pc: numerical taxonomy and multivariate analysis system, Version 2.1. State University of New York, New York, NY, USA, 37 p. URL: http://www.exetersoftware.com/downloads/ntsysguide21.pdf (15 March 2015)
- NEI M 1978 Estimation of average heterozygosity and genetic distance from a small number of individuals. Genetics 89 (3): 583-590
- HEDRICK PW 2005 Genetics of Populations. Third Edition. Jones & Bartlett Publishers, Sudbury, MA, USA, 737 p
- DURYEA ML, DOUGHERTY PM 1991 Forest Regeneration Manual. Springer Science+Business Media, Dordrecht, The Netherlands, 433 p. DOI: http://dx.doi.org/10.1007/978-94-011-3800-0
- WILK JA, KRAMER AT, ASHLEY MV 2009 High variation in clonal vs. sexual reproduction in populations of the wild strawberry, Fragaria virginiana (Rosaceae). Ann Bot 104 (7): 1413-1419. DOI: http://dx.doi.org/10.1093/aob/mcp239
- ARNAUD-HAOND S, ALBERTO F, TEIXEIRA S, PROCACCINI G, SERRÃO EA, DUARTE CM 2005 Assessing genetic diversity in clonal organisms: low diversity or low resolution? Combining power and cost efficiency in selecting markers. J Hered 96 (4): 434-440. DOI: http://dx.doi.org/10.1093/jhered/esi043
- HUNTLEY JC 1990 Robinia pseudoacacia L. Black locust. In: Burns RM, Honkala BH (eds) Silvics of North America: Volume 2. Hardwoods. USDA, Washington, DC, USA, pp 755-761
- SURLES SE, HAMRICK L, BONGARTEN BC 1990 Mating System in Open Pollinated Families of Black Locust (Robinia pseudoacacia). Silvae Genet 39 (1): 35-40
- RÉDEI K 2002 Improvement of Black Locust (Robinia pseudoacaciaL.) in Hungary. IUFRO Meeting. Management of Fast Growing Plantations. Proceedings, Izmit, Turkey, 11-13 September 2002, 166-173
- WCPM LTD Tree improvement through clonal forestry. The West Coast Paper Mills experience. The West Coast Paper Mills, Karnataka, India, 28 p. URL: http://westcoastpaper.com/images/docs/captive_plantation.pdf (22 February 2015)
- RITCHIE GA 1996 Operational Use of Vegetative Propagation in Forestry: World Overview of Cloning and Bulking. In: Landis TDO, South DB (eds) National Proceedings, Forest and Conservation Nursery Associations, Gatlinburg, TN, USA, 25-27 June 1996; New England, CT, USA, 19-22 August 1996; Salem, OR, USA, 20-22 August 1996. USDA, Forest Service, Pacific Northwest Research Station, Portland, OR, USA, pp 192-197. URL: http://www.fcanet.org/proceedings/1996/ritchie.pdf (22 February 2015)
© 2015 by the Croatian Forest Research Institute. This is an Open Access paper distributed under the terms of the Creative Commons Attribution License (http://creativecommons.org/licenses/by/4.0).